Transcription of People in Jail and Prison in 2020 - Vera Institute of Justice
1 People in jail and Prison in 2020 Jacob Kang-Brown, Chase Montagnet, and Jasmine Heiss January 2021 The United States saw an unprecedented drop in total incarceration between 2019 and 2020. Triggered by the onset of the COVID-19 pandemic and pressure from advocates to reduce incarceration, local jails drove the initial decline, although prisons also made reductions. From summer to fall 2020, Prison populations declined further, but jails began to refill, showing the fragility of decarceration. Jails in rural counties saw the biggest initial drops, but still incarcerate People at double the rate of urban and suburban areas. Despite the historic drop in the number of People incarcerated, the decrease was neither substantial nor sustained enough to be considered an adequate response to the COVID-19 pandemic, and incarceration in the United States remains a global aberration.
2 Vera Institute of Justice (Vera) researchers collected data on the number of People in local jails and state and federal prisons at both midyear and fall 2020 to provide timely information on how incarceration is changing in the United States during the COVID-19 Vera researchers estimated the national jail population using a sample of 1,558 jail jurisdictions and the national Prison population based on a sample of 49 states and the Federal Bureau of Prisons. Vera also collected data on People incarcerated and detained by the Marshals Service (USMS) and Immigration and Customs Enforcement (ICE). Both ICE and USMS house People in jails and prisons Generally, jails and prisons do not make race and gender data available.
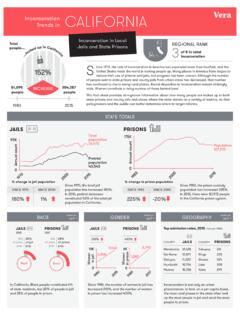
3 However, preliminary results from other studies suggest that race inequity in incarceration may be worsening during the Figure 1 The number of People incarcerated in jails and prisons from 1980 to late 2020 The number of People incarcerated in state and federal prisons and local jails in the United States dropped from around million in 2019 to million by mid-2020 a 14 percent decrease. This decline held through the fall. This represents a 21 percent decline from a peak of million People in Prison and jail in 2008. State and federal prisons held an estimated 1,311,100 People at midyear 2020 down 124,400, or 9 percent, from 2019. Prisons declined by an additional 61,800 People in late 2020, bringing the total Prison population to 1,249,300 People , a 13 percent decline from 2019 to late 2020 (the end of September or beginning of October).
4 (See Methodology on page 10 for details of the statistical analyses.) Table 1 Summary of incarcerated populations and changes by region Population Midyear Between 2019 & 2020 Late Since midyear 2020 2019 2020 Change % change 2020 Change % change Total 2,115,000 1,818,700 -296,300-14 1,814,800-3,9000 Prisons 1,435,500 1,311,100 -124,400-9 1,249,300 -61,800-5 Jails 758,419 575,500 -182,919-24 633,20057,700 10 Urban 166,979 127,800 -39,179-23141,200 13,400 10 Suburban 146,976 117,000 -29,976-20125,800 8,800 8 Small/Midsize metro 260,169 206,800 -53,369-21231,700 24,900 12 Rural 184,295 123,900 -60,395-33134,500 10,600 9 0500 ,0001,000,0001,500,0002,000,0002,500,000 19801990200020102020 Summary Total Incarceration State & Federal Prisons Local Jails 2 Local jails had steeper population declines than prisons in the first part of 2020.
5 From June 2019 to June 2020, the jail population decreased by 182,900 People , or 24 However, from June to September, jail populations increased substantially, growing 10 percent in just three months. By late 2020, there were 633,200 People in local jails, up from an estimated 575,500 People at midyear. (See Figure 1, above.) In total, the national jail population declined 17 percent from midyear 2019 to late 2020, with jail incarceration trending upward in recent months. The national jail population counts hide stark divergence across the urban-to-rural continuum. In the past year, the largest and most sustained jail population declines were in rural areas, where the jail population dropped by 60,400 (33 percent) between midyear 2019 and midyear 2020, and subsequently grew by 10,600 (9 percent) between midyear 2020 and late 2020.
6 Urban areas and small and midsized metro areas had smaller incarceration declines followed by slightly higher subsequent growth from June to September 2020. Even with dramatic declines, rural areas still have the highest incarceration rates by far. Three out of five People incarcerated in local jails are in smaller cities and rural communities. (See Table 1 above for a summary of jail incarceration population counts and percent changes by geographic type, and Table 2, below for summary incarceration rate information.) Table 2 Summary of incarceration rates and changes by region Rates per 100,000 Residents Midyear Between 2019 & 2020 Late Since midyear 2020 2019 2020 Change % change 2020 Change % change Total 644 551 -93 -14 549 -2 0 Prisons 437 397 -40 -9 378 -19 -5 Jails 237 179 -58 -24 197 18 10 Urban 168 128 -40 -24 141 13 10 Suburban 181 143 -38 -21 154 11 7 Small/Midsize metro 276 218 -58 -21 244 26 12 Rural 410 274 -136 -33 297 23 8 Table 1 and 2 note: Total incarceration numbers are adjusted downward slightly to avoid double counting People held in local jails under contract for state prisons.
7 See methodology on page 10. Figure 1 source note: The 2019 and 2020 jail and Prison population estimates are based on data collected by Vera, while 1983 through 2018 estimates are from the Bureau of Justice Statistics (BJS) Census of Jails, annual Survey of Jails, and National Prisoner Statistics. See generally BJS, Data Collection: Census of Jails Program, ; BJS, Data Collection: annual Survey of Jails (ASJ) Program, ; and BJS, Data Collection: National Prisoner Statistics (NPS) Program, The 1980 jail estimates are from the Census, see Margaret Cahalan, Historical Corrections Statistics in the United States, 1850-1984 (Washington, DC: BJS, 1986), Introduction The COVID-19 pandemic transformed daily life in the United States and brought the dehumanizing and life-shortening nature of incarceration further into the light.
8 Jails and prisons have been, and continue to be, devastated by a virus that spreads in close quarters. Many of the largest outbreaks of COVID-19 have been tied to prisons and large jails: 3,336 cases at a crowded state Prison in California s Central Valley, and 3,216 cases at the county jail in Houston, Smaller facilities have had bad outbreaks too: 229 cases at a jail meant to hold 365 People in Cascade County, Montana the first outbreak in the In March 2020, scientists and experts sounded the alarm about the risk of COVID-19 outbreaks in jails and Advocates called for releases from jails and prisons as a public health and racial Justice But no level of government took adequate mitigation measures, if they made any effort at all.
9 Many correctional officers, apparently fearing for their health, left their jobs to return to the safety of their homes; for example, after large outbreaks, around one-third of the jobs are vacant at Arkansas s two largest Incarcerated People , by definition, do not have this freedom to protect themselves, although some took matters into their own hands. As one man who escaped a federal Prison told reporters, I signed up for a jail sentence, not a death sentence. 9 New data collected by Vera and detailed in this report reveals that as the year wore on, the United States saw an unprecedented drop in total incarceration. The 3 historic changes in Prison and jail populations triggered by the COVID-19 pandemic came during a national wave of Black Lives Matter demonstrations and accompanying demands to change the criminal legal system in the United As a result, there was far more pressure on officials to release People from Prison and jail in 2020 than in prior years.
10 Local jails drove the initial decline, although prisons also made modest reductions. From summer to fall 2020, Prison populations declined further, but jails began to refill, showing the fragility of population reductions. Jails in rural counties saw the biggest initial drops, but still incarcerate People at double the rate of urban and suburban areas. Despite the historic drop in the number of People incarcerated, the United States still incarcerates a large share of its population. The decrease was neither substantial nor sustained enough to be considered an adequate response to the COVID-19 pandemic. States and localities only in very rare cases publish data on incarceration by race, ethnicity, or gender.