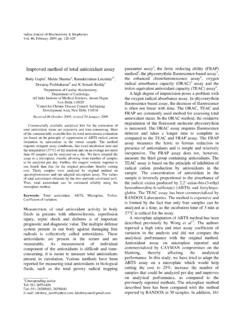
Transcription of Performing Oxygen Radical Absorbance Capacity Assays with ...
1 Performing Oxygen Radical Absorbance Capacity Assays with Synergy HT ORAC Antioxidant Tests Introduction The antioxidant capabilities of foods, cosmetics, supplements and pharmaceutical agents has become of particular interest. This is the result of the evidence demonstrating the relationship of reactive Oxygen /nitrogen species (ROS) with aging and pathogenesis. [1,2]. Living organisms: use of a fuel (ATP) whose production results in the formation of toxic compounds, and requires that a balance be maintained between the oxidants and the antioxidants . ROS (reactive Oxygen species) are generally held in check by a combination of antioxidant enzymes, proteins, and antioxidants provided by the diet. A breakdown or reduction in antioxidant capability has been associated with a number of chronic diseases. Conceivably, the ingestion of foods or supplements that contain antioxidant activity could provide some protection towards this affect.
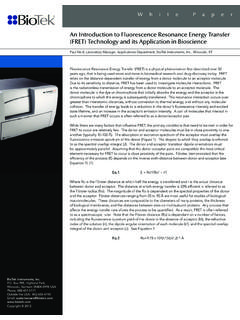
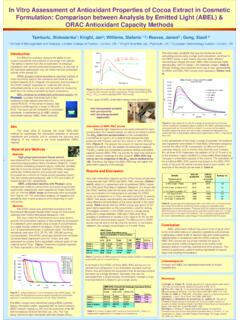
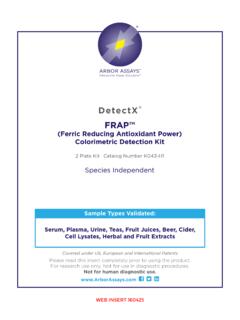
2 Figure 1. Illustration of Antioxidant activity determination expressed as the net area under the curve (AUC). The AUC for standards, samples and blanks are calculated and the blank value subtracted. A KC4 kinetic profile of a blank well and an experimental well has been modified to highlight the Net AUC as described by Huang et al. [9]. All living organisms are exposed to ROS on a continual basis. Besides exogenous sources, ROS are formed in vivo by several different mechanisms. The interaction of ionizing radiation with biological molecules can result in free Radical formation. ROS are also the byproduct of normal cellular respiration. Electrons passing through the respiratory chain often leak away and BioTek Instruments, Inc., Box 998, Highland Park, Winooski, Vermont 05404-0998 USA COPYRIGHT 2006 TEL: 888-451-5171 FAX: 802-655-7941 Outside the USA: 802-655-4740 E-mail: directly reduce Oxygen molecules to the superoxide anion.
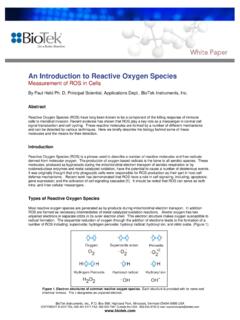
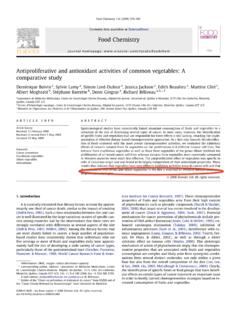
3 In addition, several dedicated enzymes in phagocytic cells ( neutrophils and macrophages) synthesize ROS as part of the normal cellular function. ROS molecules fall into two categories: ROS molecules that contain unpaired electrons ( superoxide anion, O2-; hydroxyl ion, OH-, and the hydroxyl Radical , OH) and react directly with biological molecules, and molecules that have the ability to pull electrons from other molecules (H2O2 or HOCl) and can damage biomolecules through direct interaction or initiate a chain reaction where ROS species are transferred from molecule to molecule. Figure 2. Schematic depiction of the ORAC assay . Reactive Oxygen species generators are added to parallel reactions that contain equal amounts of a fluorescent probe. Reactions contain either a buffer blank or antioxidant samples and standards.
4 The antioxidant Capacity of a sample is the net difference between the area under the curve (AUC) of the sample and that of the blank. Figure adapted from Huang et al. [9]. There are several different methods to measure total antioxidant Capacity described in the literature (3-7). The total peroxyl Radical trapping parameter Assays decribed by Wayner et al. [3] was widely used in the 1980s and early 90s. This method was replaced by more precise methods such as the ferric reducing ability of plasma (FRAP) assay [3] and the Trolox equivalent antioxidant Capacity assay (TEAC) [4]. The TEAC assay is based on the inhibition by antioxidants of the Absorbance of the cation of 2,2 -azinobis(3-ethylbenzothiazoline-6-sulfo nate) (ABTS). ABTS is also a common substrate for Absorbance based ELISA. The use of a fluorescent compound to measure antioxidant capability such as phycoerythrin increased the sensitivity [6], but suffers due to the inherent instability of the compound over time.
5 The Oxygen Radical Absorbance Capacity (ORAC) assay replaces phycoerythrin with fluorescein, which is much more stable over the time frame of the assay [7]. This assay has been automated [8] and over time converted to a microplate format [9]. Ronald Prior at Brunswick Laboratories and his colleagues have accomplished much of the development of the ORAC assay . The ORAC assay depends on the free Radical damage to a fluorescent probe, such as fluorescein, to result in a downward change of fluorescent intensity [10]. The assumption, of course, is that the degree of change is indicative of the amount of Radical damage. The presence of antioxidants results in an inhibition in the free Radical damage to the fluorescent compound. This inhibition is observed as a preservation of the fluorescent signal. Reactions containing antioxidants and or blanks are run in parallel using equivalent amounts of a ROS generator and fluorescent probe (Figure 1).
6 Because the reaction is driven to completion, one can quantitate the protection by calculating the area under the curve (AUC) from the experimental sample. After subtracting the AUC for the blank, the resultant difference would be the protection conferred by the antioxidant compound (Figure 2). Comparison to a set of known standards allows one to calculate equivalents and compare results from different samples and experiments. Typically Trolox , (6-hydroxy-2,5,7,8-tetrametmethylchroman -2-carboxylic acid) a water soluble vitamin E analog, is used as the calibration standard and ORAC results are expressed as Trolox equivalents (Figure 3). The ORAC assay is unique in that because the assay is driven to completion the AUC calculation combines both the inhibition time as well inhibition percentage of free Radical damage by the antioxidant into a single quantity.
7 Standardization of the assay with the use of a common calibrator in conjunction with an assay that can be performed easily on many different compounds, foods, and materials has allowed for an easy comparison of antioxidant capabilities of many different materials and the formation of a database [11]. Materials and Methods Sodium Fluorescein was purchased from Invitrogen. 2,2 -Azobis(2-amidinopropane) dihydrochloride (AAPH), 6-hydroxy-2,5,7,8-tetramethylchroman-2-c arboxylic acid (Trolox ), gallic acid, Epigallocatechin gallate (EGCG), epigallocatechin (EGC), and quercetin dihydrate were purchased from Sigma-Aldrich (St. Louis, Mo). Black-sided, special optics clear bottom plates (part # 3615) were obtained from Corning. The ORAC assay was performed essentially as described by Huang et. al [9]. Briefly, AAPH ( ) was dissolved in 10 ml of 75 mM phosphate buffer (pH ) to a final concentration of 153 mM and made fresh daily.
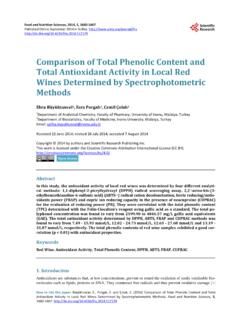
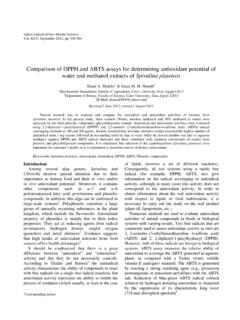
8 A fluorescein stock solution (4 x 10⁻³ mM) was made in 75 mM phosphate buffer (ph ) and stored wrapped in foil at 5 C. Immediately prior to use, the stock solution was diluted 1:1000 with 75 mM phosphate buffer (ph ). The diluted sodium fluorescein solution was made fresh daily. In regards to the plate usage, the exterior wells were not used for experimental determinations (Figure 3). These wells were filed with 300 l of water, while the interior wells were used for experimental determinations. To all experimental wells, 150 l of working sodium fluorescein solution was added. In addition blank wells received 25 l of 75 mM phosphate buffer (ph ), while standards received 25 l of Trolox dilution and samples received 25 l of sample. The plate was then allowed to equilibrate by incubating for a minimum of 30 minutes in the Synergy HT Multi-Detection Microplate Reader (BioTek Instruments, Inc.)
9 , Winooski, VT) at 37 C. Reactions were initiated by the addition of 25 l of AAPH solution using the microplate reader s injector for a final reaction volume of 200 l. The fluorescence was then monitored kinetically with data taken every minute. A Synergy HT Multi-Detection Microplate Reader with injectors was used with a 485 nm, 20 nm bandpass, excitation filter and a 528 nm, 20 nm bandpass, emission filter. The plate reader was controlled by KC4 version (revision 10). Reactions were initiated by the addition of 25 l of AAPH reagent (153 mM) followed by shaking at maximum intensity for 10 seconds. The fluorescence of each well was then measured from the bottom every 60 seconds at a sensitivity setting of 60. ORAC values were calculated as described by Cao and Prior [12]. The AUC and the Net AUC of the standards and samples were determined using KC4 Data Reduction Software (BioTek Instruments, Winooski, VT) using equations 1 and 2 respectively.
10 AUC = +(R2/R1)+(R3/R1)+(R4/R1)+..+ (Rn/R1) (Eq. 1) Where R1 is the fluorescence reading at the initiation of the reaction and Rn is the last measurement. Net AUC = AUCsample AUCblank (Eq. 2.) The standard curve was obtained by plotting the Net AUC of different Trolox concentrations against their concentration. ORAC values of samples were then calculated automatically using the KC4 software to interpolate the sample s Net AUC values against the Trolox standard curve. Figure 3. Plate map of wells typically used. Outer wells (blue-filled) were filled with 300 l of water to provide large thermal mass. Only the inner 60 wells were used for experimental determinations Results Initial experiments examined the effect of AAPH concentration on the kinetics of fluorescence decay of fluorescein in solution. As demonstrated in Figure 4, the presence of AAPH results in a marked loss of fluorescence of sodium fluorescein over time.