Transcription of PH&N Monthly Income Fund - RBC Global Asset …
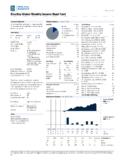
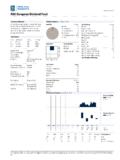
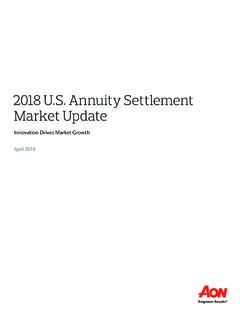
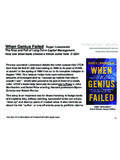
1 These pages are not complete without the disclosure page. For more details visit Monthly Income fund Performance analysis for Series A as ofMay 31, 2020 Portfolio analysis as of May 31, 2020 Equity styleCalendar returns %Growthof $10,000 SeriesA $15,419 Weight %> yield (%) earningsratio (forward) $ Mth3 Mth6 Mth1 Yr3 Yr5 Yr10 YrSince return % Quartile634634632624577431193 # of funds in category% Assets Cash Fixed Income Canadian equities equities European equities Asia-Pacific equities Emerging markets equities Investment objectiveThefundamentalinvestmentobjecti veoftheFundistoprovidearelativelyhighmon thlyincomethatmayconsistofdividendincome ,interestincome,realizedcapitalgainsanda returnofcapital,withthepotentialformodes tcapitalgrowth.
2 Byinvestinginawell-diversifiedbalancedpo rtfolioofincome-producingequitysecuritie sincluding,butnotlimitedto,commonshareso fCanadiancompaniesthatpaydividendsandinc ometrusts,andfixedincomesecuritiessuchas preferredshares,governmentandcorporatebo nds, detailsSeriesLoad structureCurrencyFund codeA No load CAD RBF7660 Adv Front end CAD RBF6660 Adv Low load CAD RBF4660 H No load CAD RBF2660 Inception dateDecember 2009 Total fund assets $MM1, A NAV $ A MER % statusOpenMinimum investment $500 Subsequent investment $25 Risk ratingLow to mediumFund categoryCanadian Neutral BalancedIncome distributionMonthlyCapital gains distributionAnnuallyMonthly distribution( /unit) payout rate (%)
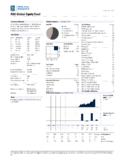
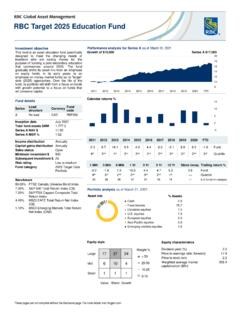
3 * * Capped Composite Total Return35%FTSE Canada Universe Bond 10%ICE BofA Merrill Lynch Canadian High Yield5%S&P/TSX Preferred Share Total ReturnNotesThis is a continuing fund resulting from a merger effective June 27, mix2010201120122013201420152016201720182 019 YTDL arge322919 Mid1035 Small110 ValueBlendGrowthPortfolio analysis continuedas of May 31, 2020 These pages are not complete without the disclosure page. For more details visit Monthly Income fund Top 10 holdings% AssetsRBC High Yield Bond fund -Series Bank of , Hager & North High Yield Bond fund -Series National Railway Asset Management Inc -Class A Energy of Nova Pacific Railway % of top 10 biosScott Lysakowski, Phillips, Hager & North Investment ManagementScottisVicePresident,SeniorPor tfolioManager,andHeadofCanadianEquitiesf orPhillips,Hager& ($)
4 /unit*YTD2019201820172016201520142013201 220112010 Interest dividends dividends Foreign taxes paid Capital gains of capital * Income type characterization and foreign taxes paid are reported at or around January to maturity (%) (years) maturity(years) sector allocation %Financials Energy Industrials Materials Communication Services Utilities Information Technology Consumer Staples Real Estate Consumer Discretionary Health Care Fixed Income breakdown%Government Bonds Corporate Bonds Other Bonds Mortgage Backed Securities ST Investments (Cash & Other) Asset Backed Securities PH&N Monthly Income fund These pages are not complete without the disclosure page.
5 For more details visit Funds, BlueBay Funds, PH&N Funds and RBC Corporate Class Funds are offered by RBC Global Asset Management Inc. and distributed through authorized , trailing commissions, management fees and expenses all may be associated with mutual fund investments. Please read the prospectus or fund Facts document before investing. Except as otherwise noted, the indicated rates of return are the historical annual compounded total returns including changes in unit value and reinvestment of all distributions and do not take into account sales, redemption, distribution or optional charges or Income taxes payable by any unitholder that would have reduced returns.
6 Mutual funds are not guaranteed or covered by the Canadian Deposit Insurance Corporation or by any other government deposit insurer. For money market funds, there can be no assurances that the fund will be able to maintain its net Asset value per unit at a constant amount or that the full amount of your investment inthe fund will be returned to you. The value of mutual funds change frequently and past performance may not be document has been compiled by RBC Global Asset Management Inc. (RBC GAM) from sources believed to be reliable, but no representations or warranty, express or implied, are made by RBC GAM, its affiliates or any other person as to its accuracy, completeness or correctness.
7 All opinions and estimates constitute RBC GAM's judgment as of the date of this document, are subject to change without notice and are provided in good faith but without legal responsibility. The Top Ten/25 Holdings may change due to ongoing portfolio transactions within thefund. The Prospectus and other information about the underlying investment funds are available at (%) for RBC Funds, PH&N Funds and BlueBay Funds is based on actual expenses for the preceding calendar year or most recent half-year period ended June 30 expressed on an annualized basis, depending on availability of data at the time of (%)
8 For RBC Corporate Class Funds is based on actual expenses for the preceding full year period ended March 31 or half-yearperiod ended September 30 expressed on an annualized basis, depending on availability of data at the time of H and Series I are not available for purchase by new investors. Existing investors who hold Series H or Series I unitscan continue to make additional investments into the same series of the funds they are only used to illustrate the effects of the compound growth rate and do not reflect future values of any fund or returns on investment of any of $10K chart shown represents a hypothetical investment of the fund over the last 10 years.
9 Or from the last day of the since inception month for funds with less than 10 years performance fund profile is provided for informational purposes only. Particular investments and/or trading strategies should be evaluated relative to each individual s investment objectives. The information contained in the fund profile is not, and should not be construed as, investment or tax advice. You should not act or rely on the information contained in the fund profile without seeking the advice of an appropriate professional rankings are determined by Morningstar Research Inc.
10 , an independent research firm, based on categories maintained by the Canadian Investment Funds Standards Committee (CIFSC). Quartile rankings are comparisons of the performance of a fund to other funds in aparticular category and are subject to change Monthly . The quartiles divide the data into four equal segments expressed in terms of rank(1, 2, 3 or 4). / Trademark(s) of Royal Bank of Canada. Used under licence. RBC Global Asset Management Inc. 2020