Transcription of Pharma Mar SA PHM QQQ - Bolsa de Madrid
1 Pharma Mar SA PHM QQ 21 Jul 2020 02:00 UTCLast CloseFair ValueQMarket CapSectorIndustryCountry of Domicile21 Jul 202021 Jul 2020 02:00 UTC21 Jul , MildHealthcareBiotechnologyESPS painThere is no one analyst in which a Quantitative Fair Value Estimate and QuantitativeStar Rating are attributed to; however, Mr. Lee Davidson, Head of QuantitativeResearch for Morningstar, Inc., is responsible for overseeing the methodology thatsupports the quantitative fair value. As an employee of Morningstar, Inc., is guided by Morningstar, Inc.
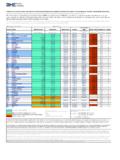
2 S Code of Ethics and Personal SecuritiesTrading Policy in carrying out his responsibilities. For information regarding Conflictsof Interests, visit ProfilePharma Mar SA is engaged in the research, development,production, and commercialization of bio-active principles ofmarine origin for application in oncology. It also produces andmarket insecticides and air fresheners for household use,household products, wood treatment and decoration products,paints, and similar products. Its operating business segmentsare Oncology, Diagnostics, Consumer chemicals, and company obtains its revenues from two main areas:biopharmaceuticals and consumer chemicals, but theQuantitative ScoresScoresAllRel SectorRel CountryQuantitative MoatNone607246 ValuationOvervalued111 Quantitative UncertaintyHigh868482 Financial HealthModerate754739 Source.
3 Morningstar Equity ResearchdESPPHM Undervalued Fairly ValuedOvervalued ValuationCurrent5-Yr AvgSectorMedianCountryMedianPrice/Quant Fair P/E , Cash , Dividend Yield % AvgSectorMedianCountryMedianReturn on Equity % on Assets % (K) HealthCurrent5-Yr AvgSectorMedianCountryMedianDistance to Score vs. Quantitative Fair Value30609012015020162017201820192020202 1 Quantitative Fair Value EstimateTotal ReturnSales/ShareForecast RangeForcasted PriceDividendSplitMomentum: Standard Return % +/ Market (Morningstar WorldIndex) Dividend Yield % Dividend Yield % , RatingQQQQQQQQQQQQQQQQ201520162017201820 19 TTMF inancials (Fiscal Year in K)
4 192,814180,943179,337162,16385,819165, % Change11,329-18,706-17,681-14,149-17,475 62,153 Operating % Change6,588-24,082-26,745-5,535-11,37969 ,674 Net Income11,101-8,414-1,459-16,340-26,13716 4,891 Operating Cash Flow-9,221-6,093-4,665-2,375-3,911-4,140 Capital Spending1,880-14,507-6,124-18,715-30,048 160,751 Free Cash % % Cash Flow/Share Value/Share18,44218,41618,44018,43618,49 618,359 Shares Outstanding (K) on Equity % on Assets % Margin % Margin % Margin %64,97367,58373,60764,92253,06343,554 Long-Term Debt76,87452,35826,86621,37311,37481,304 Total Asset TurnsGrowth Per Share1-Year3-Year5-Year10-YearRevenue % Income % Earnings % Dividends % Book Value % Total Return % Revenue & EPSR evenue (Mil) Per Share () Growth Year On Year % Equity Report | Release: 21 Jul 2020, 23:01 UTC | Reporting Currency: EUR | Trading Currency: EUR | Exchange:XMAD Morningstar 2020.
5 All Rights Reserved. Unless otherwise provided in a separate agreement, you may use this report only in the country in which its original distributor is based. The information, data, analyses andopinions presented herein do not constitute investment advice; are provided solely for informational purposes and therefore is not an offer to buy or sell a security; are not warranted to be correct, complete or accurate; andare subject to change without notice. Except as otherwise required by law, Morningstar shall not be responsible for any trading decisions, damages or other losses resulting from, or related to, the information, data,analyses or opinions or their use.
6 The information herein may not be reproduced, in any manner without the prior written consent of Morningstar. Please see important disclosures at the end of this report. Page 1 of 4 Quantitative Equity Reports OverviewThe quantitative report on equities consists of data, statistics and quantitativeequity ratings on equity securities. Morningstar, Inc. s quantitative equityratings are forward looking and are generated by a statistical model that isbased on Morningstar Inc. s analyst-driven equity ratings and quantitativestatistics.
7 Given the nature of the quantitative report and the quantitativeratings, there is no one analyst in which a given report is attributed to; however,Mr. Lee Davidson, Head of Quantitative Research for Morningstar, Inc., isresponsible for overseeing the methodology that supports the quantitativeequity ratings used in this report. As an employee of Morningstar, Inc., is guided by Morningstar, Inc. s Code of Ethics and Personal SecuritiesTrading Policy in carrying out his Equity RatingsMorningstar s quantitative equity ratings consist of: (i) Quantitative Fair ValueEstimate, (ii) Quantitative Star Rating, (iii) Quantitative Uncertainty, (iv)Quantitative Economic Moat, and (v) Quantitative Financial Health (collectivelythe Quantitative Ratings).
8 The Quantitative Ratings are calculated daily and derived from the analyst-driven ratings of a company s peers as determined by statistical , Inc. ( Morningstar , we , our ) calculates Quantitative Ratingsfor companies whether or not it already provides analyst ratings and qualitativecoverage. In some cases, the Quantitative Ratings may differ from the analystratings because a company s analyst-driven ratings can significantly differ fromother companies in its peer Quantitative Fair Value Estimate: Intended to represent Morningstar sestimate of the per share dollar amount that a company s equity is worth calculates the Quantitative Fair Value Estimate using a statisticalmodel derived from the Fair Value Estimate Morningstar s equity analystsassign to companies.
9 Please go for information about FairValue Estimate Morningstar s equity analysts assign to Quantitative Economic Moat: Intended to describe the strength of afirm s competitive position. It is calculated using an algorithm designed topredict the Economic Moat rating a Morningstar analyst would assign to thestock. The rating is expressed as Narrow, Wide, or assigned when the probability of a stock receiving a Wide Moat rating by an analyst is greater than 70% but less than 99%.Wide assigned when the probability of a stock receiving a Wide Moat rating by an analyst is greater than 99%.
10 None assigned when the probability of an analyst receiving a WideMoat rating by an analyst is less than 70%.iii. Quantitative Star Rating: Intended to be the summary rating based onthe combination of our Quantitative Fair Value Estimate, current market price,and the Quantitative Uncertainty Rating. The rating is expressed as One-Star,Two-Star, Three-Star, Four-Star, and the stock is overvalued with a reasonable margin of (Quant FVE/Price) < -1*Quantitative UncertaintyTwo-Star - the stock is somewhat (Quant FVE/Price) between (-1*Quantitative Uncertainty, *QuantitativeUncertainty)Three-Star the stock is approximately fairly (Quant FVE/Price) between ( *Quantitative Uncertainty, *QuantitativeUncertainty)Four-Star the stock is somewhat (Quant FVE/Price)