Transcription of PHILIPPINE PLAN OF ACTION FOR NUTRITION 2017-2022 A …
1 Phili ppi ne Plan of Acti on for Nutri ti on 2017-22 Executi ve summary 1 Republic of the Philippines Department of Health NATIONAL NUTRITION COUNCIL PHILIPPINE PLAN OF ACTION FOR NUTRITION 2017-2022 A call to urgent ACTION for Filipinos and its leadership executive summary 1. The PHILIPPINE Plan of ACTION for NUTRITION (PPAN) 2017-2022 is an integral part of the PHILIPPINE Development Plan 2017-2022 . It is consistent with the Duterte Administration 10-point Economic Agenda, the PHILIPPINE Health Agenda, and the development pillars of malasakit (protective concern), pagbabago (change or transformation), and kaunlaran (development), and the vision of Ambisyon 2040. It factors in and considers country commitments to the global community as embodied in the 2030 Sustainable Development Goals, the 2025 Global Targets for Maternal, Infant and Young Child NUTRITION , and the 2014 International Conference on NUTRITION .
2 2. It is a results-based plan with SMART results at different levels designed in a results framework. 3. It consists of 8 NUTRITION -specific programs, and initial list of 10 NUTRITION -sensitive programs, and 3 enabling programs. Member agencies of the National NUTRITION Council (NNC), namely, Department of Health, Department of Agriculture, Department of Social Welfare and Development, Department of Education, Department of Budget and Management, Department of Labor and Employment, Department of Trade and Industry, National Economic Development Authority, Department of Interior and Local Government, and the Department of Science and Technology, other national government agencies, local government units (LGUs), non-government organizations (NGOs), academic institutions, and development partners can undertake one or more of these programs.
3 For better accountability, a member agency of the NNC Governing Board has been designated as lead for these programs. For some programs, the designated lead is the NNC Secretariat. 4. The PPAN 2017-2022 comes with a budget estimate for the entire period of six years. The plan has a monitoring and evaluation framework showing the plan for progress monitoring and evaluation through the six-year period. 5. The National NUTRITION Council Secretariat led and coordinated the plan formulation. Plan formulation started with the conduct of a NUTRITION landscape analysis commissioned by NNC with support from Micronutrient Initiative, now NUTRITION International, and the United Nations Children s Fund (UNICEF). A team of Filipino Phili ppi ne Plan of Acti on for Nutri ti on 2017-22 Executi ve summary 2 consultants conducted the assessment from August to October 2016 using landscape analysis based on document reviews, focus group discussions (FGDs), key informant interviews, inter-sectoral consultations and validation meetings with a wide range of stakeholders.
4 The results of the analysis are contained in a separate document, Situation Analysis of NUTRITION in the Philippines . However, its key findings are in the first part of the plan document. 6. Plan formulation was participatory, inter-sectoral, and multi-level. It engaged the participation of the NNC member agencies and their department senior officials at the national and regional levels as well as members of provincial and municipal NUTRITION committees of LGUs where the FGDs were held, 6 regions, 5 provinces, and 22 cities and municipalities. 7. Two consultation meetings, prior to the drafting of the plan and after the plan was drafted, were convened to ensure a wide participation in plan formulation. 8. The first round of consultation with an inter-sectoral group of 16 agencies joined by development partners and the academe was held in Tagaytay City on 12-16 September 2016.
5 During the consultation, the national NUTRITION situation was reviewed together with issues related to policy and program formulation and implementation. The overall strategy and programs for PPAN 2017-2022 was agreed on during this consultation. 9. The second round of consultation was held in Cebu on 17-18 November 2016. During this consultation, more specific directions for the programs identified in the Tagaytay workshop were discussed and refined. 10. This was followed by two more meetings of the NNC Technical Committee on 23 November 2016, and 12 January 2017 before the final approval of the NNC Governing Board on 21 February 2017. 11. Even as the PPAN 2017-2022 was being formulated, related concerns were brought into discussions of relevant sectors of the PHILIPPINE Development Plan, agriculture, fisheries and forestry.
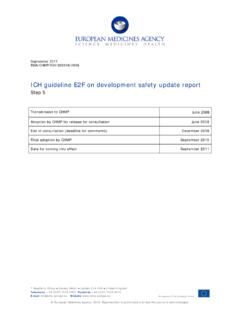
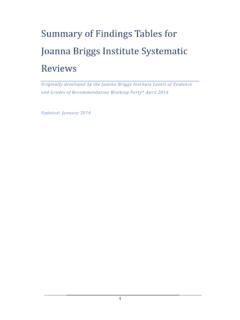
6 12. The PPAN 2017-2022 is divided into two parts: Part 1 consists of a summary of the situation analysis of NUTRITION in the country in 2016; and Part 2 presents the plan. NUTRITION problems to be addressed 13. High levels of stunting and wasting among children under-five years of age, with levels that have remained unchanged over the years (Figure 1). Also stunting is relatively low among infants 0-11 months old, but is significantly higher among one-year olds (Figure 2). The prevalence of stunting remains high for the older children. Phili ppi ne Plan of Acti on for Nutri ti on 2017-22 Executi ve summary 3 Figure 1. Trends in the Prevalence of Malnutrition among Children Under Five Years Old: National NUTRITION Surveys (NNS), 1989-2015 Source: FNRI-DOST.
7 1989-2015 NNS Figure 2. Trends in the Prevalence of Stunting in Children from Birth to Three Years: NNS, 2008 to 2015 14. Deficiencies in vitamin A, iron, and iodine particularly among groups for which the problem is of public health significance (Table 1) 23 20 20 40 01020304050198919941999200420092014 UnderweightStuntingWastingOverweight-for -height Phili ppi ne Plan of Acti on for Nutri ti on 2017-22 Executi ve summary 4 Table 1. Prevalence rate of micronutrient malnutrition Micronutrient deficiency/Population group affected Prevalence rate 2008 2011 2013 Vitamin A deficiency: % of children 6 mos-6 years old with low to deficiency serum retinol No data Anemia: % of anemic women of reproductive age (20-39 years old) No data Iodine deficiency: - Median urinary iodine concentration ug/L (Should be 100 ug/L for children 6-12 years old, and lactating women, and 150 ug/L for pregnant women) o Children, 6-12 years old 132 No data 168 o Pregnant women 105 No data 105 o Lactating women 81 No data 77 - Percent with iodine excretion concentration <50 mcg/L (should be less than 20%) o Children, 6-12 years old o Lactating women Source.
8 FNRI-DOST. 2008-2015 NNS 15. Hunger and food insecurity with of Filipino households not meeting their caloric requirements. While this level is lower than that recorded in 1989 ( ) it is higher than the level reported in 1998 (57%) and 2008 (67%). 16. At the same time, overweight and obesity among various population groups should be addressed, especially among adults (Figure 3). Phili ppi ne Plan of Acti on for Nutri ti on 2017-22 Executi ve summary 5 Figure 3. Overweight and obesity among various population groups 17. Maternal NUTRITION should also be addressed as survey results have shown that the prevalence of nutritionally-at-risk women has not improved over the years, with a prevalence rate between 24-26% since 2008.
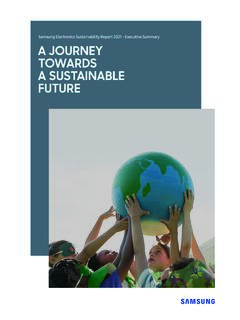
9 Furthermore, adolescent pregnant women, those of poor educational attainment, coming from the poorest wealth quintile, and are employed have relatively higher levels of undernutrition (Figure 4). Maternal NUTRITION could also affect the NUTRITION of the growing fetus. Figure 4. Prevalence of Nutritionally At-Risk Pregnant Women by Age, Educational Attainment, Place of Residence and Wealth Index Source: FNRI-DOST. 2015 Nati onal Nutri ti on Survey 18. Poor infant and young child feeding in the first two years of life coupled with bouts of infection can explain the high levels of stunting. 19. Exclusive breastfeeding (EBF) in the first six months of life continues to be a challenge. EBF increased from in 2011 to in 2013 but went back to 49 15 0102030405060No gr ade completedElem , not com pletedElem graduateHigh school undergradHigh school gra duateVoc ational under graduateVoc ational graduateCollege, undergraduteCollege, gra duateEducational attainment< 20 20 Age (years) 010203040 Wor kingnon-workingWor king/employment statusUrbanRuralPlace of residencePoorestPoorestMiddleRichRichest Wealth index Phili ppi ne Plan of Acti on for Nutri ti on 2017-22 Executi ve summary 6 in 2015.
10 However, a look at EBF rates by single age group within the 0-5 months-old band would show declining EBF with the lowest rate among the 5-month olds (Table 2). The low rate of EBF together with the rate of never breastfed represent sub-optimal breastfeeding practice. These low rates deprive the infant of needed nutrients for optimum growth at the time when his or her growth is most rapid. Table 2. Proportion of exclusive breastfeeding among infants 0-5 months old, by single age. Philippines, 2011 2015 Age in months Exclusive breastfeeding, in % 2011 2013 2015 All (0-5) 0 1 2 3 4 5 Source: NNS 2011. 2013, and 2015, DOST-FNRI. Note: CV of estimates are 10% for all the age groups, except for the 5-month ol d group for whi ch the CV i s i n 2011, i n 2013 and i n 2015 and are cons i dered acceptabl e.