Transcription of Phoenix Area Economic Summary - Bureau of Labor Statistics
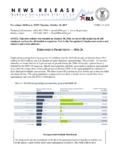
1 Updated January 03, 2022 Average weekly wages for all industries by countyPhoenix metro area, second quarter 2021( = $1,241; Area = $1,201)Source: BLS, Quarterly Census of Employment and Area Economic SummaryThis Summary presents a sampling of Economic information for the area; supplemental data are provided for regions and the nation. Subjects include unemployment , employment, wages, prices, spending, and benefits. All data are not seasonally adjusted and some may be subject to revision. Area definitions may differ by subject.
2 For more area summaries and geographic definitions, see rates for the nation and selected areasOver-the-year changes in employment on nonfarm payrolls and employment by major industry cityPinal CountyMaricopa CountyPhoenix metroareaArizonaUnited StatesNov-20 Nov-21 Source: BLS, Local Area unemployment metro areaUnited StatesSource: BLS, Current Employment percent changes in employmentNumberPercentTotal nonfarm2, and tructi , transportation, and and business and health and s er vi c : BLS, Current Empl oyment Sta ti s ti cs.
3 Change from Nov. 2020 to Nov. 2021 Nov. 2021 Phoenix metro area employment(number in thousands)Over-the-year change in the prices paid by urban consumers for selected categoriesOver-the-year changes in the selling prices received by producers for selected industries nationwideAverage hourly wages for selected occupationsOver-the-year changes in wages and salariesWestern Information Office 415-625-2270 Average annual spending and percent distribution for selected categoriesEmployer costs per hour worked for wages and selected employee benefits by geographic itemsFoodEnergyPhoenix metro city
4 AverageSource: BLS, Consumer Price percent change in CPI-U, October freight truckingHospitalsHotels (exc casino hotels) and motelsSource: BLS, Producer percent changes in PPI$21,094$21,043$12,776$10,257$6,737$7, 744$6,693$7,205$5,238$5,185$9,928$10,754 0%20%40%60%80%100% Phoenix metro areaUnited StatesAll other itemsHealthcarePersonal insurance & pensionsFoodTransportationHousingAverage annual expenditures, United States and Phoenix metro area, 2019-20 Source: BLS, Consumer Expenditure metro areaUnited StatesAll occupations$ $ resources and head and ceiling tile : BLS, Occupational Employment and Wage Statistics , May industry,September 2021 West census regionUnited StatesTotal compensation$ $ Wages and Total Paid Supplemental Retirement and Legally required : BLS, Employer Costs for Employee metro areaUnited StatesSource: BLS, Employment Cost percent changes in ECI
