Transcription of PM2.5/PM10 Particle Sensor Analog Front-End for …
1 TI Designs Particle Sensor Analog Front-End for Air Quality Monitoring Design TI Designs Design Features This TI Design provides an Analog Front-End (AFE) AFE Design for (< m) and pm10 (<10- m). solution for measuring and pm10 particulate Particle Detection and Count matter (PM). The design detects the light scattered by Dust Range From 12 to 35 pcs/cm3. particles suspended in air. A sample software algorithm is provided to convert the Analog output of Accuracy of 75% Over Detection Range the design into a Particle size and concentration AFE With Transimpedance Amplifier Stage and measurement.
2 Test result data for cigarette smoke, Two Filtering and Amplification Stages Arizona dust, and mulberry pollen are provided along 0-V Bias to Minimize Photodetector Noise and with all software and hardware design files. Stabilize Performance Over Temperature Design Resources Instrumentation Amplifier Topology to Reject External Noise Sources TIDA-00378 Design Folder Rail-to-Rail Output for Increased Output INA132 Product Folder Dynamic Range OPA2320 Product Folder Low-Noise, Low-Input Bias Current, and Low- OPA320 Product Folder Offset Op Amps to Maintain High SNR.
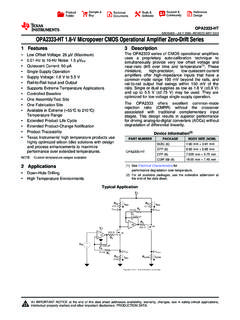
3 MSP-EXP430G2 Product Folder Adjustable Gain on Each Amplification Stage Tested Against Arizona Dust, Mulberry Pollen, and Cigarette Smoke Using Adapted ANSI/AHAM AC- ASK Our E2E Experts 1-2013 Test Standard Full Algorithm Source Code for and pm10 . Calculation LED Driver With Adjustable Current Featured Applications Building Automation Air Quality Monitors VREF + OPA2320.. VCC INA132 . VOUT.. + +. +. OPA2320 OPA2320.. VREF + OPA2320. Transimpedance LED driver Amplification and filter stage Amplification and filter stage stage Copyright 2016, Texas Instruments Incorporated An IMPORTANT NOTICE at the end of this TI reference design addresses authorized use, intellectual property matters and other important disclaimers and information.
4 All trademarks are the property of their respective owners. TIDUB65C December 2015 Revised May 2016 Particle Sensor Analog Front-End for Air Quality Monitoring 1. Submit Documentation Feedback Design Copyright 2015 2016, Texas Instruments Incorporated Key System Specifications 1 Key System Specifications Table 1. Key System Specifications PARAMETER SPECIFICATION DETAILS. Cigarette smoke particles ( to m diameter). Particle types and sizes detectable by the Dust particles ( to 3- m diameter) Section 6. AFE. Pollen particles (5- to 11- m diameter). Pollen: 5 to 40 pcs/cm3.
5 Particle concentration range supported by Dust: 10 to 255 pcs/cm3 Section 6. AFE. Smoke: 12,000 to 24,000 pcs/cm3. Particle concentration measurement Dust: 75% accuracy over a pm10 concentration of 12 to 35 pcs/cm3. Section 6. accuracy (1) (using linear calibration and a 60-second moving average). AFE input voltage V, nominal Section AFE current consumption 13 mA, average Section LED driver current consumption Adjustable Section Form factor 44 19 mm Section (1). Accuracy calculated using high-resolution, real-time aerodynamic TSI 3321 Aerodynamic Particle Sizer Spectrometer as reference.
6 2 System Description Different methods exist to measure the amount of Particle matter (PM) suspended in air. Optical-based PM measurement instruments utilize the properties of absorption and light scattering to measure Particle count, size, and concentration. Although these instruments differ in complexity, accuracy, and cost, they all share the same basic components: a light source directed at the particles , a detector to measure the light scattered (or absorbed) by the particles , an AFE to interface with the detector, and signal processing to analyze the output of the AFE.
7 The Particle Sensor Analog Front-End Design is capable of detecting Particle matter with a diameter between and 10 m ( pm10 ) and Particle matter with a diameter less than m ( ). This TI Design filters and amplifies the output from a photodiode and produces an output signal that can be processed by a microcontroller. The transimpedance stage uses an OPA2320 dual-package precision CMOS operational amplifier (op amp) and an INA132 single-supply difference amplifier to convert the output current of the photodetector into a voltage. The filter and amplification stages use the OPA2320 op amp with a tunable gain and basic RC-filters.
8 A light-emitting diode (LED) driver with an adjustable LED. current is also included in the design. The design is implemented on a single-ended, four-layer board of a size of 44 19 mm with a build-of- materials (BOM) count of 37 components. The TI Design interfaces with the photodiode and LED of an existing optical chamber through dedicated pads on the board. This TI Design was tested using pollen, dust, and smoke particles the full test procedure and results are included in this design guide. This design guide addresses component selection, design theory, and test results of the entire TI Design system.
9 The information provided in this design guide gives system designers a fully-tested reference design, which can be easily modified to meet different system requirements. 2 Particle Sensor Analog Front-End for Air Quality Monitoring TIDUB65C December 2015 Revised May 2016. Design Submit Documentation Feedback Copyright 2015 2016, Texas Instruments Incorporated Block Diagram 3 Block Diagram VREF + OPA2320.. VCC INA132 . VOUT.. + +. +. OPA2320 OPA2320.. VREF + OPA2320. Transimpedance LED driver Amplification and filter stage Amplification and filter stage stage Copyright 2016, Texas Instruments Incorporated Figure 1.
10 Particle Sensor Block Diagram Highlighted Products The Particle Sensor AFE Design features the following devices: OPA2320 and OPA320 (Section ): precision, 20-MHz, bias current, rail-to-rail I/O, CMOS. op amp INA132 (Section ): Low-power, single-supply difference amplifier For more information on each of these devices, see their respective product folders at TIDUB65C December 2015 Revised May 2016 Particle Sensor Analog Front-End for Air Quality Monitoring 3. Submit Documentation Feedback Design Copyright 2015 2016, Texas Instruments Incorporated Block Diagram OPA320 and OPA2320 Description The OPA320 (single) and OPA2320 (dual) are a new generation of precision, low-voltage CMOS op amps optimized for very low noise and wide bandwidth while operating on a low quiescent current of only mA.