Transcription of population series - OECD
1 Normand LauzonDirector of Sahel and West Africa Club Dr. Mohamed Ibn ChambasExecutive Secretary of ECOWASECOWAS-SWAC/OECD 2006 - August 2006 CSAOSWAC population seriesMigrationThe Atlas on Regional Integration is an ECOWAS SWAC/OECD initiative, financed by the development cooperation agencies of France, Switzerland and Luxembourg. Divided into four series ( population , land, economy, environment), the Atlas chapters are being produced during 2006-2007 and will be available on-line on the site though it may be useful, a global approach to migration is not sufficient as the nature and challenges of this phenomenon are not the same in North America, Latin America, Asia and Africa. In this light, the Economic Community of West african States (ECOWAS) and the Sahel and West Africa Club (SWAC) intend to contribute to strategic thinking on the region through this chapter of the Atlas on Regional Integration in West migration is a politically sensitive issue in the North, as well as in the South.
2 The debate it raises is often passionate, even extreme and dangerous. We feel that the best approach is to place observed facts at the centre of the debate. Hence, we have requested that facts should be presented here on the basis of available knowledge, and that the challenges be summarised in light of scientific literature. The result, which of course is never perfect, will require regular updates, since movements of populations and migration policies are often changing. We have also requested that the migration demographic context be well described, because we realise that this aspect is generally given very little attention. The fact, however, is that sub-Saharan Africa is the last large region in the world where population growth is above per year. Nowhere else is pressure on mobility, in every sense of the word, so strong. ECOWAS member States have embarked on the difficult but irreversible path to the free movement of persons.
3 This option also takes into account the history of the people of West Africa. Irrespective of future trends of migration policies of developed countries, intra-regional mobility (at least seven times more than the volume of migration from West Africa to the rest of the world) should be preserved. However, Africa should not be passive. Therefore, we feel it is important for the debate to focus more on the future than on the past, that the States of the region should define common priorities taking into account their individual specific realities, and that future policies and investments should be anticipated on Regional Integration Ain West Africa tlas on Regional Integration Ain West Africa01020304050036912151960 2000 Percentage in 2000 Percentage in 1960 Europe North America Africa Asia Percentage of migrants in total population NORTHAMERICAEUROPEAFRICAWESTAFRICAASIAN umber of migrants (in millions) Sources : IOM and CMMI 2005 SWAC - OECD 2006 IntroductionThis summary of data and analysis of global, african and West african migration contains rough estimates as do all the documents and studies regarding this subject.
4 Official statistics are hardly reliable or accurate, including those of some OECD countries. population surveys are not using the same criteria to differentiate nationals, migrants and foreigners: nationality, place of residence, and length of stay outside country of birth. There is consensus on the definition of a migrant as a person over 15 years old living for more than one year in a country of which he is not a national; the Atlas refers to this definition, but also cites available information on more rapid population movements in West Africa. Clandestine migrations, on the other hand, elude any serious quantitative evaluation. Furthermore, the definition of foreigner is relative and changing. One can be a foreigner, but may not have migrated (for example, the children of migrants born in the host countries of their parents).
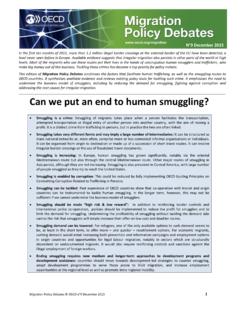
5 Economic and social crises, political exploitation, and the evolution of world geopolitics are some of the factors which provoke or maintain confusion, and move debate on migrations away from the analysis of facts. Map 1. Number of Migrants by Continent in 1960 and 2000population series 01020304050036912151960 2000 Percentage in 2000 Percentage in 1960 Europe North America Africa Asia Percentage of migrants in total population NORTHAMERICAEUROPEAFRICAWESTAFRICAASIAN umber of migrants (in millions) Sources : IOM and CMMI 2005 SWAC - OECD 2006I. International migration Overview: From a Global View to the african Two Hundred Million MigrantsIn 2005, there were 200 million migrants in the world, representing 3% of the global population . This figure is more than double that of 1970. The 1980s is marked by a sharp increase in migration (100 million migrants in 1980, 150 million in 1990).
6 Since then, the growth rate has returned to the levels comparable to those of the 1960s and 1970s. The migration boom of the 1980s was due mainly to the dismem-berment of the former Soviet Union and the development of mobility within the Asian continent (particularly to India). Currently, the host regions, in decreasing order, are: Asia (44 million), North America (41 million), Europe (33 million), the territories of the former Soviet Union (30 million), and Africa (16 million). More than half of the migrants are concentrated in 15 host countries. The United States tops the list as this country was built on immigration, sometimes receiving several millions of people each year between the mid-19th century and the early Despite the downward trend of movements, the USA remains an important host country,2 and about 35 million migrants currently live there.
7 Only three other members of the G7 are on the list of main immigrant recipient countries alongside developing countries which are nevertheless regional economic hubs (for example, C te d Ivoire in 14th position with million migrants). OECD countries, with wealthier economies and more affluent lifestyles, receive a little less than half of the migrants identified in the world (97 million in 2000). 40% of these migrants come from other OECD countries. migration is far from being oriented only from South to North. african migration to Developed Countries african migration to developed countries is marginal. In 2004, there were million officially identified african migrants in OECD Member countries, representing 13% of immigrants from non-member countries. Figure 1. The 15 Major Countries of Immigration in 2000051015202530354045 IranC te d'IvoireHong KongKazakstanUnited KingdomPakistanAustraliaSaudi ArabiaCanadaFranceIndiaUkraineGermanyRus sian FederationUSA% of populationmillionsSource: United Nations 20031.
8 Million Irish went to the United States in 1848; million Italians in In 2002, there were million foreigners who entered the country (OECD, 2004). tlas on Regional Integration Ain West AfricaThey include million North Africans and million sub-Saharan Immigration is very concentrated whereas nine OECD countries are host to 90% of african expatriates. In North America, african immigration is quantitatively high ( million people), but low in comparison to other communities. For example, in 2000, there were 8 million Mexicans and 900,000 Africans in the United States; in Canada there were 300,000 Africans, 750,000 Chinese, and 150,000 AFRICATANZANIAANGOLAALGERIAMADAGASCARMOZ AMBIQUEBOTSWANAZAMBIAGABONCENTRAL african TED IVOIRELIBERIASIERRA LEONEGUINEABURKINAFASOTHE OFCONGOEQUATORIALGUINEAWESTERNSAHARADJIB OUTISENEGALGUINEA BISSAU3 OURCE 5 NITED.
9 ATIONS -AP PRODUCED IN COLLABORATION WITH . 2 OBIN )2$ $AKAR 37!# /%#$ .UMBER OF MIGRANTS IN MILLIONS TO TO AND TO TO TO TO TO AND 0 ERCENTAGE OF MIGRANTS PER COUNTRY NO AVAIBLE DATATOGOBENINGHANALIBERIASIERRA LEONEGUINEAC TED IVOIRE Map 2. Number of Migrants in Africa3. Statistics obtained after processing DELSA-OECD data for the 2000s, excluding series In four European countries, african migration is sizeable without being the majority: While in the Netherlands, the three highest numbers of foreign communities (excluding developed countries) come from Surinam, Indonesia and Turkey (about 200,000 people for each of them), the Moroccan community is high (150,000 people). In Spain, South American communities are twice as numerous as african communities, among whom Moroccans are the majority (310,000 people). In the United Kingdom, nationals of the Indian sub-continent (1 million) exceed those from the african continent (830,000).
10 Three african communities each comprise about 100,000 people: South Africa, Kenya and Nigeria. Table 1. Major Host Countries in OECD excluding Germany in the 2000s (in thousands)West AfricaBeninBurkina FasoCameroonC te d'IvoireGhanaGuineaGuinea BissauLiberiaMaliMauritaniaNigerNigeriaS enegalSierra : DELSA/OECD Database 2004 The GambiaCape VerdeFigure 2. migration from West african Countries to OECD Countries in the 2000s05000010000015000020000025000030000 0 NigeriaGhanaSenegalCapeVerdeC ted' GambiaTogoMauritaniaChadBurkinaFasoNiger ThousandsSource: DELSA/OECD tlas on Regional Integration Ain West Africa Italy receives million immigrants from developing countries. The largest immigrant community comes from the former Yugoslavia (200,000) and the second from Morocco (155,000). Africans represent one-third of the three other European countries, more than 50% of immigrants from developing countries are Africans: In Belgium, the main community is Moroccan (100,000 people), followed by the Turks (70,000), and the Congolese (DRC 40,000).