Transcription of Portfolio analysis - Excel and VBA
1 Portfolio analysis Copyright: Dr Ian O Connor, CPA Page 1 of 16 Portfolio analysis A Portfolio can be viewed as a combination of assets held by an investor. For each asset held, such as company stocks, the logarithmic or continuously compounded rate of return r at time t is given by = where is the stock price at time t, and is the stock price in the prior period. The volatility of stock returns, over period N is often estimated by the sample variance = 1 where r is the return realized in period t, and N is the number of time intervals. As the variance of returns is in units of percent squared, we take the square root to determine the standard deviation.
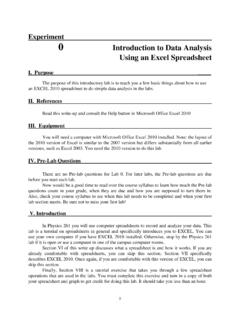
2 Example (file: ) Suppose an investor has a four stock Portfolio comprising of shares on the Australian stock market as listed in Figure 1. Fig 1: Excel functions - descriptive statistics The stock codes AGK, CSL, SPN, and SKT from figure 1 are described in figure 2. Portfolio analysis Copyright: Dr Ian O Connor, CPA Page 2 of 16 Fig 2: Portfolio components - description 1. Descriptive statistics Price data for the four stocks is obtained from Yahoo Finance and is filtered for monthly price observations. In figure 1, Column A of the worksheet shows the date for the first trading day of the month. Closing prices for the four stocks are in the range B9:E21.
3 The corresponding continuously compounded return series, using the Excel LN function, are calculated in the range G9:J21. Summary information from Excel statistical functions are shown in rows 23 to 27, using the Excel 2007 formulas for standard deviation and variance (the Excel 2010 equivalent formula is in column F). Descriptive statistics can also be produced by using the Descriptive Statistics item from the Data analysis dialog as shown in figure 3. Figure 3: Data analysis dialog box with Descriptive Statistics selected The output for the Descriptive Statistics is shown in the New Worksheet ply in figure 4. Figure 4: analysis ToolPak (data analysis ) - descriptive statistics Rows 7 and 8 of the worksheet shown in figure 4 have values for the sample standard deviation and sample variance respectively (rows 7 and 8).
4 We will see later, that the Data analysis > Covariance item returns population values, not sample values. When assets are held as part of a Portfolio , an important consideration is the amount of co-movement between Portfolio components. Portfolio analysis Copyright: Dr Ian O Connor, CPA Page 3 of 16 2. Covariance The amount of co-movement can be measured by the covariance statistic, and is calculated on a pair-wise basis. The formula for the sample covariance , for the return vectors of stock i and stock j is , = , ! , " ! 1 There are number of ways the estimation can be operationalized and some techniques are described in this section.
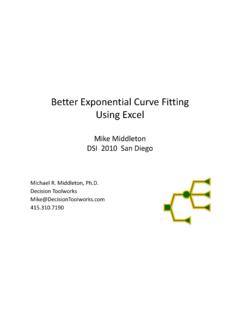
5 Methods include the analysis ToolPak Covariance item (figure 3), and Excel functions listed here. Excel 2007 COVAR(array1,array2) Returns covariance, the average of the products of paired deviations Excel 2010 (array1,array2) Returns the sample covariance, the average of the products deviations for each data point pair in two data sets (array1,array2) Returns covariance, the average of the products of paired deviations The worksheet in figure 7 shows output for the analysis ToolPak (ATP) covariance item in rows 32 to 36. The covariance matrix, from the ATP is a lower triangular table, meaning it only returns the main diagonal elements, and the lower left elements.
6 By definition, the covariance of a vector with itself, is the variance of the vector. Thus, the value in cell G33 in figure 5, #$%,#$%= , is the same value as the population variance returned by the Excel VARP function shown in figure 1 cell G28. Fig 5: Variance covariance matrix - ATP and COVAR versions In Excel 2007 and earlier, there is only one covariance function, COVAR and it returns the population covariance for two return vectors. In figure 5, rows 39 to 43, the COVAR function uses Excel range names for each of the return vectors. The return values are population estimates. Construction of the individual cell formulas can be simplified by using range names with the INDIRECT function.
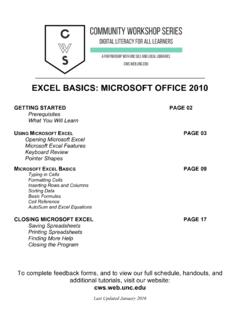
7 To do this: Copy and paste the stock codes vector to the range G46:J46. Using Paste Special > Transpose, paste the transposed stock codes vector to F47. Portfolio analysis Copyright: Dr Ian O Connor, CPA Page 4 of 16 Enter the formula =COVAR(INDIRECT(F$47),INDIRECT($G46)) at G47. Copy and paste the formula to complete the variance covariance matrix. The return values, and cell formulae are shown in figure 6. Fig 6: Variance covariance matrix - COVAR and INDIRECT version 3. Covariance with VBA The Excel 2007 COVAR function returns the population covariance. To estimate the sample covariance, the custom function Covar_s has been developed.
8 Here is the code. VBA: Covar_s (Available in the ) 10 20 30 40 50 60 70 80 90 100 Function Covar_s(InArray1 As Variant, InArray2 As Variant) As Variant Dim NumRows As Long, NumRows1 As Long, NoRows2 As Long Dim i As Long, j As Long Dim InArrayType1 As String Dim InArrayType2 As String Dim InA1 Ave As Double, InA2 Ave As Double Dim Temp1() As Double, Temp2 As Double On Error GoTo ErrHandler InArrayType1 = TypeName(InArray1) InArrayType2 = TypeName(InArray2) If InArrayType1 = "Range" Then NumRows = UBound( , 1) - _ LBound( , 1) + 1 ElseIf InArrayType1 = "Variant()" Then NumRows = UBound(InArray1, 1) - LBound(InArray1, 1)
9 + 1 Else GoTo ErrHandler End If Portfolio analysis Copyright: Dr Ian O Connor, CPA Page 5 of 16 110 120 130 140 150 160 170 180 190 200 210 220 ReDim Temp1(1 To NumRows) With InA1 Ave = .Average(InArray1) InA2 Ave = .Average(InArray2) For i = 1 To NumRows Temp1(i) = (InArray1(i) - InA1 Ave) * (InArray2(i) - InA2 Ave) Next i Temp2 = .Sum(Temp1) / (NumRows 1) End With Covar_s = Temp2 Exit Function ErrHandler: Covar_s = CVErr(xlErrNA) End Function Covar_s is the sample version of the +,, equation with n 1 in the denominator rather than n. The sample covariance is calculated in lines 150 to 180 of the code.
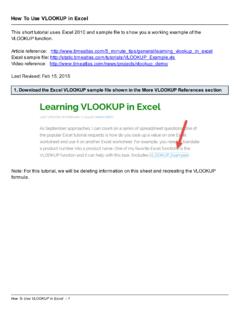
10 The For .. Next loop at lines 150 to 170 returns the numerator of the equation as a vector to the array named Temp1. The sum of Temp1 .Sum(Temp1) is then divided by n 1 in line 180. Covar_s is useful if you open the workbook on an Excel 2007 or earlier platform. If you only use Excel 2010 or later, then or are available. Figure 7 show the output for the Covar_s custom function, and the Excel 2010 function. Fig 7: UDF Covar_s and Excel 2010 The example in figure 7 uses a nested function in combination with range names. Portfolio analysis Copyright: Dr Ian O Connor, CPA Page 6 of 16 The next code section provides a custom function to return the variance-covariance as a single array formula.