Transcription of Portfolio Optimization - SpreadsheetML
1 Financial Modeling Templates Portfolio Optimization Copyright (c) 2009-2014, ConnectCode All Rights Reserved. ConnectCode accepts no responsibility for any adverse affect that may result from undertaking our training. Microsoft and Microsoft Excel are registered trademarks of Microsoft Corporation. All other product names are trademarks, registered trademarks, or service marks of their respective owners Pg ii Portfolio Optimization Version Table of Contents 1. Portfolio Optimization .. 1-1 Background .. 1-1 Risk Reward Trade Off Line .. 1-1 Risk Reward Trade Off Line Spreadsheet .. 1-1 Inputs .. 1-2 Outputs .. 1-2 Risk Reward Trade Off Line .. 1-2 Correlations of 1-2 Portfolio Optimization (2 Assets).
2 1-3 Efficient Portfolio .. 1-3 Efficient Frontier .. 1-3 Tangency Portfolio .. 1-4 Inputs .. 1-4 Outputs .. 1-4 Usage of Optimal 1-4 Optimal Combination of Risky Assets Curve .. 1-5 Efficient Trade Off 1-6 Portfolio Optimization (7 Assets) .. 1-6 Setup Microsoft Excel Solver .. 1-6 Using Microsoft Excel Solver in this spreadsheet model .. 1-6 Inputs .. 1-7 Outputs .. 1-8 2. Portfolio Optimization (7 Assets) by performing regression on historical prices .. 2-12 PortInternal Worksheet .. 2-12 How is the data downloaded? .. 2-12 GetStock subroutine .. 2-13 DownloadData subroutine .. 2-15 Pg iii Portfolio Optimization Version ConnectCode s Financial Modeling Templates Have you thought about how many times you use or reuse your financial models?
3 Everyday, day after day, model after model and project after project. We definitely have. That is why we build all our financial templates to be reusable, customizable and easy to understand. We also test our templates with different scenarios vigorously, so that you know you can be assured of their accuracy and quality and that you can save significant amount of time by reusing them. We have also provided comprehensive documentation on the templates so that you do not need to guess or figure out how we implemented the models. All our template models are only in black and white color. We believe this is how a professional financial template should look like and also that this is the easiest way for you to understand and use the templates. All the input fields are marked with the * symbol for you to identify them easily.
4 Whether you are a financial analyst, investment banker or accounting personnel. Or whether you are a student aspiring to join the finance world or an entrepreneur needing to understand finance, we hope that you will find this package useful as we have spent our best effort and a lot of time in developing them. ConnectCode Pg 1-1 Portfolio Optimization Version 1. Portfolio Optimization Background In 1952, Harry Markowitz published a paper on Portfolio selection and the effects of diversification on security returns. His works have a great impact on modern finance and have led to the development of the Capital Asset Pricing Model by William Sharpe, Linter and Mossin. In the Portfolio Risk spreadsheet, we have developed a model to calculate the Returns, Mean, Variance and Standard Deviation of a Portfolio based on historical prices.
5 The calculation allows us to see the effects of diversification in the Portfolio . We are taking a step further in this Portfolio Optimization spreadsheet by optimizing the allocation of the assets in the Portfolio using Markowitz theory. We will start with a worksheet that models the Risk Reward Trade Off Line followed by by a worksheet that models Portfolio Optimization of 2 Assets. With these two worksheets as a basis, we will use the Microsoft Excel Solver to model the complex Portfolio Optimization of more than 2 assets. Finally we will integrate our Portfolio Optimization model with stock prices downloaded from A regression of the historical prices will be performed automatically and the output average returns, correlations, variances and covariances will be used for the Portfolio Optimization model.
6 Risk Reward Trade Off Line The basic principle of the Risk Reward Trade Off Line is the more risk you take, the higher your reward. Of course, the flip side is the possibility of you losing more money. Markowitz theory allows us to vary the amount of risk we undertake in the hope of achieving the returns we expected. The basic concept is to build a Portfolio which consists of a normal asset like a stock or a bond with another Riskless Asset like the Treasury Bills. By varying the proportion of each asset, it allows us to vary the amount of risk we wish to undertake vs the returns we hope to achieve. Risk Reward Trade Off Line Spreadsheet The model in the "PortfolioRiskRewardTradeOffLine" worksheet allows us to combine the normal asset and a Riskless asset to model the Risk Reward Trade Off Line.
7 Pg 1-2 Portfolio Optimization Version Inputs Expected Return Riskless Asset - This can be the published rate of a Treasury Bill or an assumed riskless rate. Standard Deviation of Riskless Asset - This is assumed to be zero as the asset is considered riskless. Expected Return of Asset - This can be estimated by using historical prices of the asset or an assumed expected return. Standard Deviation of Asset - This can be estimated by calculating the standard deviation of the asset from historical prices and assumed standard deviation. Outputs The worksheet uses the Portfolio theory to calculate the expected return of the Portfolio using the following formula: Expected Return of Portfolio = Weight of normal asset * Expected Return of normal asset + Weight of Riskless asset + Expected Return of Riskless asset.
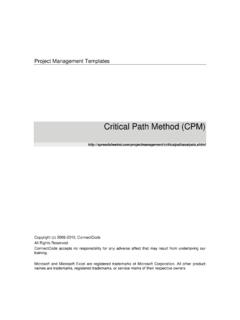
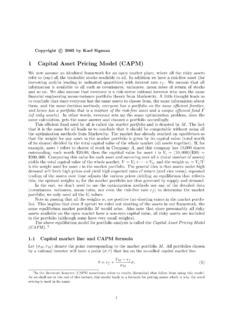
8 The standard deviation of the Portfolio is the proportion of total assets invested in the risky asset multiply by the standard deviation of the risky asset. This is because the standard deviation of the riskless asset is considered to be zero. Risk Reward Trade Off Line The graph shows the different proportion of the normal and Riskless asset. It is simple to see that by investing proportionately more on the normal asset, it may allow us to achieve more returns but at the same time will subject us to more risks. Thus the risk appetite of the investor will determine the various proportions of the Portfolio to use. Correlations of Assets One of the basic aspects of building a Portfolio is to include assets which are negatively or have a small positive correlation with each other.
9 When the assets in a Portfolio do not move in the same direction, it is thought to be safer as they do not fluctuate as much. In the next few sections, we will see correlation between the different assets to be an assumed number or calculated from the regression of historical asset prices. Pg 1-3 Portfolio Optimization Version Portfolio Optimization (2 Assets) In the PortfolioOptimization2 Assets worksheet, we will use Markowitz theory to optimize the proportions of the 2 normal risky assets and the riskless asset in the Portfolio . By optimizing the Portfolio , we will have a Portfolio that is considered as an efficient Portfolio . Efficient Portfolio A efficient Portfolio is one that combines the different assets to provide the highest level of expected return while undertaking the lowest level of risk.
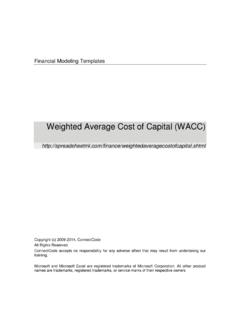
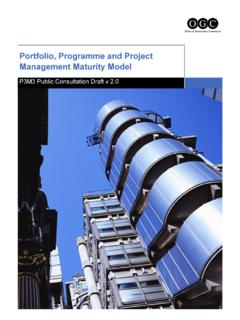
10 Efficient Frontier The graph below shows the attainable set of portfolios by combining the different risky assets as dark dots. From the point X to the point Y in the blue curve, it allows us to achieve highest level of return with the minimal risk we have to undertake. This set of portfolios is known as the efficient frontier. The efficient frontier has been proven to be a hyperbola curve when expected return is plotted against standard deviation. Pg 1-4 Portfolio Optimization Version Tangency Portfolio The Tangency Portfolio is a Portfolio that is on the efficient frontier with the highest return minus risk free rate over risk. In other words, it is the Portfolio with the highest Sharpe ratio. Inputs Expected Return of Riskless Asset - This can be determined from the Treasury Bills or Bonds.