Transcription of Poverty in the United States: 50-Year Trends and Safety ...
1 Poverty in the United States: 50-Year Trends and Safety Net Impacts March 2016. By Ajay Chaudry, Christopher Wimer, Suzanne Macartney, Lauren Frohlich, Colin Campbell, Kendall Swenson, Don Oellerich, and Susan Hauan Office of Human Services Policy Office of the Assistant Secretary for Planning and Evaluation Department of Health and Human Services Table of Contents Executive 1. The War on Poverty .. 1. Key Trends in Reducing Poverty and Economic Deprivation .. 2. Safety Net programs Alleviate Poverty .. 3. Economic Context and Challenges .. 4. The Economic Circumstances of Key Population Groups .. 6. Clear Progress Made, Further Efforts Needed .. 7. Part I: 50-Year Poverty Levels and Trends .. 8. Poverty Fluctuates with Economic 8. Spotlight on Safety Net Expenditures Over Time .. 10. Part II: Impact of the Safety Net on Poverty .. 12. Historical Trend: The Safety Net Reduces Poverty .. 12. Safety Net programs Reduce Overall Poverty Rate.
2 14. Larger Poverty Rate Impact Among Program Recipients .. 17. Spotlight on Deep Poverty .. 19. Part III: Poverty Trends for Vulnerable Populations .. 23. Poverty through the Lens of Women, Families, and Children .. 23. Single-Mother Families Increase, Poverty Declining but High .. 24. Higher Poverty Rate for Blacks and Hispanics .. 26. Poverty Rates by Human Capital: Education and Employment .. 28. Education-Driven Poverty Gap Is 28. Poverty and Employment .. 31. Employment Is Declining for Black Men with Less Education .. 33. The Geography of Poverty .. 34. Poverty Is Becoming Less Concentrated in 34. Poverty Remains High in South, Increases in West .. 36. 37. Reducing Poverty Improves Child Development and Subsequent Outcomes .. 38. Job- and Skills-Driven Training Get Results .. 38. Poverty of Place Matters .. 39. The Next 50 Years .. 39. Appendix A: Program Source Data .. 40. Appendix B: How is Poverty Measured?
3 41. Official Poverty Measure .. 41. supplemental Poverty Measure .. 42. Alternative Poverty Measure .. 43. Endnotes .. 44. Executive Summary The War on Poverty Just over 50 years ago, President Lyndon B. Johnson declared an unconditional war on Poverty , and signed the Economic Opportunity Act of 1964 and the Civil Rights Act of 1964 into law. The initiatives undertaken as part of the War on Poverty were designed to improve the education, skills, health, and resources of low- income individuals and families to help them expand their productivity and ability to make ends meet and enhance their lifelong economic outcomes. Many cornerstones of the modern-day social Safety net ( , food stamps, later renamed the supplemental nutrition assistance Program [SNAP], Community Health Centers, Head Start) were first established in 1964. The additional building blocks of Medicaid, Medicare, and Title I of the Elementary and Secondary Education Act followed in 1965, among many new and expanded anti- Poverty programs .
4 Building on this foundation, the Safety net has expanded during the past 50 years to further alleviate Poverty and better meet the needs of low- income individuals and families. Some of the major additions to the Safety net included the supplemental Security income (SSI) program in 1972, the Women, Infants, and Children (WIC) nutrition program in 1972, Pell Grants in 1972, the Earned income Tax Credit (EITC). in 1975, the child support program in 1975, the Low income Home Energy assistance Program (LIHEAP). in 1981, the Children's Health Insurance Program (CHIP) in 1997, Medicare Part D (Low income Subsidy). in 2003, and the Affordable Care Act (ACA) in 2010. This report provides a statistical portrait of progress in the reduction of Poverty and economic hardship over the past five decades among America's most vulnerable citizens. The Poverty measures presented in this volume show that the federal Safety net has advanced the economic circumstances of low- income children and families since 1964.
5 Three key metrics assess whether families were able to secure resources to meet their basic human needs and avoid severe material deprivation: 1) Official Poverty measure. Developed by Mollie Orshansky in 1963-1964 and designated as the federal government's official statistical definition of Poverty in The initial measure determined levels of basic need, which have been updated only for inflation. The measure accounts for the cash resources available to meet needs, but does not include non-cash benefits. In the 1960s, the federal social Safety net was much smaller than today and consisted largely of cash benefit programs , most notably the Aid to Families with Dependent Children (AFDC) program. 2) supplemental Poverty measure. First released by the Census Bureau for 2009, it offers a modern measurement of family needs and includes tax credits and noncash benefits as available Unlike the official Poverty measure which is updated only for inflation, the supplemental measure is updated as spending on basic necessities among lower income families changes.
6 The supplemental Poverty measure allows for an analysis of the current impact of the full array of government policies and programs on Poverty rates in recent years. 1. 3) Alternative Poverty measure. Recently developed by researchers at Columbia University, it extends the supplemental Poverty measure back decades and fills the critical gap in knowledge necessary to evaluate the impact of the full federal Safety net prior to Drawing on the supplemental Poverty measure, the alternative Poverty measure in this report takes the cost of basic necessities at 2012 spending levels, and applies these spending levels to each year between 1967 and 2012, adjusting only for inflation. By anchoring or fixing at 2012 spending levels, the alternative Poverty measure sets a fixed assessment of what constitutes basic needs. These needs are then compared to a broader, more comprehensive set of income and in-kind resources over time.
7 By employing the official Poverty , the supplemental Poverty , and the alternative Poverty measures, this report highlights shifts and changes not only in overall Poverty rates and Trends , but demonstrates the clear positive impact of the evolving social Safety net on the economic well-being of individuals and families during the past 50 years. Key Trends in Reducing Poverty and Economic Deprivation The War on Poverty and subsequent initiatives and programs substantially reduced the level of Poverty in the United States and provided critical supports to improve the lives of the most vulnerable children and families, particularly in the areas of nutrition assistance , housing access, health care coverage, child support for families, and employment support for workers. Compared to 1972, in 2012 the school breakfast and lunch programs provided meals to million more children; Medicaid/CHIP covered million more recipients; and million more households received housing assistance to help ensure they had adequate Among programs created after 1972, in 2012 the child support program assisted million children and the EITC raised the family income of million working tax filers (Table 1).
8 Poverty measures gauge a family's financial ability to meet the basic needs of each family member within the context of the economic conditions of the nation. The measures also account for the breadth and depth of the social Safety net available to ease periods of hardship. Tracking Poverty Trends over economic cycles highlights the importance of the Safety net's rapid response to increased need during times of economic contraction, most notably in recent years. Poverty has decreased for the overall population since the 1960s. Official Poverty in the United States stood at percent in 1964 and decreased by percentage points to percent in 2014, moving up and down with economic cycles. The official Poverty rate for children decreased by percentage points, from percent to percent, during this time. 1. A 2014 Council of Economic Advisors report also used this measure to examine Poverty Trends (The Council of Economic Advisors, The War on Poverty 50 Years Later: A Progress Report (2014), at 2.)
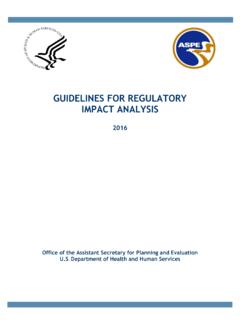
9 These increases are likely due to both policy changes and population growth. 2. The alternative Poverty measure shows the Safety net's impact on reducing Poverty rates has increased greatly over time. Since the 1960s the share of Americans lifted out of Poverty by government programs has increased tenfold. The Safety net cut the Poverty rate nearly in half in 2012, from percent to percent. Nearly 40 million people, including more than 8 million children, were lifted out of Poverty in 2012 (Figure 1). By comparison, government programs in 1967 lifted less than 3 million people out of Poverty and reduced the Poverty rate by percentage points. During periods of economic contraction, the Safety net slows potential growth in Poverty and alleviates many severe conditions of material deprivation. At the start of the Great Recession in 2007, the alternative Poverty measure shows the Safety net reduced the share of the population in Poverty by percentage points.
10 The Poverty reduction impact of federal anti- Poverty policies and programs grew in response to the recession and by 2012, the Safety net reduced the alternative Poverty rate by percentage points. Figure 1. Number of People Lifted out of Poverty , Using the Alternative Poverty Measure, 1967 and 2012. 100. Lifted Out of Poverty 80 In Poverty Number (in millions). 60. 40. 20. 0. 1967 2012. Source: Calculations based on Wimer et al. 2013. Trends in Poverty with an Anchored supplemental Poverty Measure. Institute for Research on Poverty Discussion Paper No. 1416-13. Safety Net programs Alleviate Poverty The supplemental Poverty measure also allows for a program-by-program analysis of the Safety net's impact on Poverty rates in recent years, an analysis that is not possible with historical data. Individual programs reach distinct segments of the low- income population and help needy families in different ways, from cash income supports and near-cash food and nutrition assistance , to subsidies for housing and energy costs, to facilitating the financial support of children from non-custodial parents.