Transcription of Poverty Trends in South Africa - statssa.gov.za
1 Poverty Trends in South Africa An examination of absolute Poverty between 2006 and 2015 THE South Africa I KNOW, THE HOME I UNDERSTANDKoch Street, Salvokop, Pretoria, 0002 Private Bag X44, Pretoria, 0001, South AfricaUser information service: +27(12) 310 8600, Fax: +27(12) 310 8944 Main switchboard: +27(12) 310 8911, Fax: +27(12) 310 8944 Website: , Email: South Africa , 2017Dr Pali Lehohla, Statistician-GeneralReport No. 03-10-06 Poverty Trends in South Africa An examination of absolute Poverty between 2006 and 2015 Poverty Trends in South Africa : An examination of absolute Poverty between 2006 and 2015 / Statistics South AfricaPublished by Statistics South Africa , Private Bag X44, Pretoria 0001 Statistics South Africa , 2017 Users may apply or process this data, provided Statistics South Africa (Stats SA) is acknowledged as the original source of the data; that it is specified that the application and/or analysis is the result of the user's independent processing of the data; and that neither the basic data nor any reprocessed version or application thereof may be sold or offered for sale in any form whatsoever without prior permission from Stats SA Library Cataloguing-in-Publication (CIP) DataPoverty Trends in South Africa : An examination of absolute Poverty between 2006 and 2015 / Statistics South Africa .
2 Pretoria: Statistics South Africa , 2017 Report No. 03-10-06138ppISBN: 978-0-621-45754-4A complete set of Stats SA publications is available at Stats SA Library and the following libraries:National Library of South Africa , Pretoria DivisionNational Library of South Africa , Cape Town DivisionLibrary of Parliament, Cape TownBloemfontein Public LibraryNatal Society Library, PietermaritzburgJohannesburg Public LibraryEastern Cape Library Services, King William's TownCentral Regional Library, PolokwaneCentral Reference Library, MbombelaCentral Reference Collection, KimberleyCentral Reference Library, MmabathoThis report is available on the Stats SA website: are obtainable from: Reprographics, Statistics South AfricaTel:012 310 8619012 310 8161 Email: technical enquiries, please contact:Werner RuchTel: 012 406 3317 Email: notes3 Chapter 1: Background to the Background to the national Poverty The 'social wage' Structure of this report10 Chapter 2.
3 Key Poverty from 2006 to Progress towards NDP Inputs for SDG Brief analysis of economic and social conditions in South Africa between 2000 and 201642 Chapter 3: Findings on individual Poverty and Poverty and population Poverty and Poverty and Poverty and Poverty and settlement Additional tables for LBPL and FPL70 Chapter 4: Findings on household Household Poverty and Household Poverty and population Household Poverty and Household Poverty and Household Poverty and Household Poverty and settlement Additional tables for LBPL and FPL92 Chapter 5: Findings on household Average household Household expenditure for poor and non-poor Household expenditure and sex by household Household expenditure in rural and urban Summary110 Chapter 6: Explanatory Poverty The instruments of data How the surveys were Data Time Sample Response Comparison to previous Poverty reports121 Chapter 7: Concepts and definitions123 References127 List of tablesTable : Comparison of past four household expenditure surveys (IES & LCS)7 Table : Inflation-adjusted Poverty lines, 2006 to 2017 (per person per month in rands)8 Table : Proportion of households that had access to the listed services between 1996 and 20169 Table : Poverty headcounts and the number of poor persons in 2006, 2009, 2011 and 201514 Table : Poverty gaps in 2006, 2009, 2011 and 201516 Table : NDP Poverty and inequality-related targets17 Table : SDG indicators based on Poverty and inequality-related targets28 Table : SAMPI measures by province for 2001, 2011 and 201632 Table : Ranking of provinces using Poverty headcount from 2001 to 201635 Table.
4 Proportion of people living below 50% of median income per capita by age (2006, 2009, 2011 and 2015)42 Table : Poverty measures by sex (UBPL)57 Table : Poverty measures by population group (UBPL)58 Table : Poverty measures by age (UBPL) 60 Table : Poverty shares by age (UBPL)61 Table : Poverty measures by educational level attained for individuals aged 18 and older (UBPL)63 Table : Poverty share by educational level attained for individuals aged 18 and older (UBPL)64 Table : Poverty measures by province (UBPL)64 Table : Poverty measures by settlement type (UBPL)68 Table : Poverty measures by sex (LBPL)70 Table : Poverty measures by population group (LBPL)71 Table : Poverty measures by age (LBPL)71 Table : Poverty measures by educational level attained for individuals aged 18 and older (LBPL)71 Table : Poverty measures by province (LBPL)72 Table : Poverty measures by settlement type (LBPL)72 Table : Poverty measures by sex (FPL)72 Table : Poverty measures by population group (FPL)72 Table : Poverty measures by age (FPL)73 Table : Poverty measures by educational level attained for individuals aged 18 and older (FPL)73 Table : Poverty measures by province (FPL)73 Table : Poverty measures by settlement type (FPL)74 Table : Poverty measures of households by sex of household head (UBPL)79 Table : Poverty measures of households by population group of household head (UBPL)81 Table : Household Poverty shares by age of household head (UBPL)83 Table : Poverty measures of households by age of household head (UBPL)83 Table : Poverty measures of households by educational level of the household head (UBPL)85 Table : Household Poverty shares by educational level attained for individuals aged 18 and older (UBPL)86 Table.
5 Poverty measures of households by province (UBPL)86 Table : Poverty measures of households by settlement type (UBPL)90 Table : Poverty measures of households by sex of household head (LBPL)92 Table : Poverty measures of households by population group of household head (LBPL)92 Table : Poverty measures of households by age of household head (LBPL)92 Table : Poverty measures of households by educational level of household head (LBPL)93 Table : Poverty measures of households by province (LBPL)93 Table : Poverty measures of households by settlement type (LBPL)93 Table : Poverty measures of households by sex of household head (FPL)93 Table : Poverty measures of households by population group of household head (FPL)94 Table : Poverty measures of households by age of household head (FPL)94 Table : Poverty measures of households by educational level of household head (FPL)94 Table : Poverty measures of households by province (FPL)95 Table : Poverty measures of households by settlement type (FPL)95 Table : Average annual household consumption expenditure in 2015 by population group of household head and change from 200699 Table : Average expenditure on food items by Poverty status102 Table : Percentage distribution of average annual household consumption expenditure on main expenditure groups by settlement type, 2006 2015110 Table : The reference food basket based on the IES 2010/2011116 Table : Data collection activities by week for the IES 2005/2006 and LCS 2008/2009118 Table : Data collection activities by week for the IES 2010/2011 and LCS 2014/2015119 Table : Response rates for the IES 2005/2006, LCS 2008/2009, IES 2010/2011 and LCS 2014/2015121 List of figuresFigure.
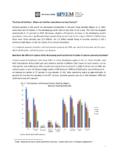
6 Poverty headcounts based on the FPL, LBPL and UBPL (2006, 2009, 2011 and 2015)15 Figure : The number of poor persons in South Africa (in thousands) (2006, 2009, 2011 and 2015)15 Figure : Proportion of population living below the lower-bound Poverty line (LBPL) by sex (2006, 2009, 2011 and 2015)18 Figure : Proportion of population living below the lower-bound Poverty line (LBPL) by population group (2006, 2009, 2011 and 2015)19 Figure : Proportion of population living below the lower-bound Poverty line (LBPL) by sex and population group (2006, 2006, 2011 and 2015)19 Figure : Poverty gap for the lower-bound Poverty line (LBPL) by sex and population group (2006, 2009, 2011 and 2015)20 Figure : Gini coefficient based on income per capita and expenditure per capita (2006, 2009, 2011 and 2015)21 Figure : Gini coefficient (income per capita) by population group (2006, 2009, 2011 and 2015)22 Figure : Gini coefficient (expenditure per capita) by population group (2006, 2009, 2011 and 2015)22 Figure : Share of income going to the bottom 40% in South Africa (2006, 2009, 2011 and 2015)23 Figure : Share of income for bottom 40% of income earners by population group (2006, 2009, 2011 and 2015)24 Figure : Share of income for bottom 40% of income earners by sex and population group (2006, 2009, 2011 and 2015)25 Figure : Estimated percentage of persons vulnerable to hunger in South Africa (2002 2016)26 Figure : Proportion of population living below the food Poverty line (FPL) by sex (2006, 2009, 2011 and 2015)26 Figure : Proportion of the population living below the LBPL by sex (2006, 2009, 2011 and 2015)29 Figure : Proportion of the population living below the LBPL by age (2006, 2009, 2011 and 2015)29 Figure.
7 Poverty gap ratio (LBPL) by sex (2006, 2009, 2011 and 2015)30 Figure : Poverty gap ratio (LBPL) by age group (2006, 2009, 2011 and 2015)31 Figure : Proportion of older persons receiving old-age grants by sex in 201536 Figure : Proportion of older persons receiving old-age grants by province in 201537 Figure : Proportion of households with children receiving child support grants by sex of the household head in 201537 Figure : Proportion of households with children receiving child support grants by province in 201538 Figure : Gini coefficient measures for South Africa (2006, 2009, 2011 and 2015) 39 Figure : Gini coefficient measures for South Africa by sex (2006, 2009, 2011 and 2015)40 Figure : Proportion of people living below 50% of median income per capita by sex (2006, 2009, 2011 and 2015)41 Figure : Proportion of people living below 50% of median income per capita by age (2006, 2009, 2011 and 2015)41 Figure : Gross domestic product from 2004 to 2016 (annualised percentage change in the seasonally adjusted quarterly values at constant 2010 prices)43 Figure : Number of unemployed persons and the unemployment rate (2003 2016)44 Figure : Industrial/Manufacturing production (seasonally adjusted)45 Figure : Oil price (2003 2016)46 Figure : Headline CPI (2004 2016)47 Figure : Inflation (2009 2016)48 Figure : Interest rates (2004 2016)49 Figure : Retail sales (constant 2012 prices)50 Figure : South African households' debt-to-disposable income (2000 2015)51 Figure : Number of social grants disbursed between 2000 and 201652 Figure : Poverty headcount by sex (UBPL) (2006, 2009, 2011 and 2015)56 Figure : Poverty headcount by population group (UBPL) (2006, 2009, 2011 and 2015)58 Figure.
8 Poverty headcount by age (UBPL) (2006, 2009, 2011 and 2015)59 Figure : Poverty headcount by educational level attained for individuals aged 18 and older (UBPL) (2006, 2009, 2011 and 2015)61 Figure : Poverty headcount by province (UBPL) (2006, 2009, 2011 and 2015)65 Figure : Comparison of Poverty share by province between 2011 and 2015 (UBPL)66 Figure : Poverty share by province in 2015 (UBPL)66 Figure : Poverty headcount by settlement type (UBPL) (2006, 2009, 2011 and 2015)68 Figure : Poverty incidence of households by sex of household head (UBPL) (2006, 2009, 2011 and 2015)79 Figure : Poverty incidence of households by population group of household head (UBPL) (2006, 2009, 2011 and 2015)80 Figure : Poverty incidence of household Poverty by age of household head (UBPL) (2006, 2009, 2011 and 2015)82 Figure : Poverty incidence of households by educational level of household head (UBPL) (2006, 2009, 2011 and 2015)84 Figure : Household Poverty gap by province (UBPL) (2006, 2009, 2011 and 2015)87 Figure : Household Poverty share by province, 2015 (UBPL)88 Figure : Comparison of household Poverty share by province between 2011 and 2015 (UBPL)88 Figure : Poverty incidence of households by settlement type (UBPL) (2006, 2009, 2011 and 2015)89 Figure : Average annual household consumption expenditure in 2015 and change from 2006 by broad expenditure category98 Figure : Average annual household consumption expenditure in 2015 and change from 2006 by Poverty status100 Figure : Food expenditure patterns of poor vs non-poor households in main expenditure groups104 Figure : Average annual household consumption expenditure on main expenditure groups by sex of the household head, 2015107 Figure.
9 Share of annual household consumption expenditure by quintiles(2006, 2009, 2011 and 2015)108 Figure : Percentage distribution of households by sex of household head and expenditure per capita quintile, 2015109 List of mapsMap : Poverty headcounts by province in 2001 (SAMPI)33 Map : Poverty headcounts by province in 2011 (SAMPI)33 Map : Poverty headcounts by province in 2016 (SAMPI)34 PrefaceThis report presents Poverty levels and Trends based on data collected by Stats SA through the Income and Expenditure Survey (IES) and Living Conditions Survey (LCS). These data sources provide us with comparable data points for 2006, 2009, 2011 and now 2015, based on the results of the recently released LCS 2014/2015. The Poverty indicators in this report have been derived using household expenditure data collected through a combination of the diary and recall methods and utilising the rebased national Poverty lines published in 2015.
10 The report focuses on the Poverty profile of individuals and households at national and provincial levels. 1