Transcription of Power and Sample Size - University of Bristol
1 Power and Sample size In epigenetic epidemiology studies Overview Pros and cons Working examples Concerns for epigenetic epidemiology Definition Power is the probability of detecting an effect, given that the effect is really there Or likewise, the probability of rejecting the null hypothesis when it is in fact false An example; Power of = if we performed a study 1000 times, we would see a statistically significant difference 80% of the time Why perform them Ideally: To determine the Sample size required to confidently observe an anticipated effect Or, at least.
2 To determine if there is sufficient Power to detect a meaningful difference in a given Sample size Required as part of a grant proposal Part of planning and designing good quality research Familiarise yourself with the data and study design Implement changes to improve the Power and design Limitations They are not universal but depend on; Purpose, methodology, statistical design and procedure Provide the minimum number of samples required following the best case scenario Based on statistical assumptions and data characteristics, Which if incorrect (or unknown) will lead to inaccurate estimates They are not intuitive.
3 They may suggest a number of subjects that is inadequate for the statistical procedure Hence, Power should not be the only consideration when deciding on your Sample size What you need to know Core elements Power Sample size Significance Effect size * These elements are all inter-related such that; If you know three you can estimate the fourth Manipulating one influences the others *A note on effect size There are many ways to define and calculate effect size Difference in means Variance explained Odds ratio Standardised vs.
4 Unstandardised measures If possible use unstandardized measures Raw difference between group means Raw regression coefficients Use standardised effect sizes as a last resort Standardised difference (d): difference in means/SD Pearson s correlation coefficent (r) Effect d r Small Medium Large Cohen s recommendations Deciding on levels of and Power (sensitivity) [1- ] Probability of finding a true effect when one does exist Type 2 error [ ]: incorrectly accepting the null hypothesis (false negative) Aim to minimise the risk of failing to detect a real effect Typical values for Power are 80%, 90% and 95% Significance (p-value) [ ] Probability that an effect occurred by chance alone Type 1 error [ ].
5 Incorrectly rejecting the null hypothesis (false positive) Aim to minimise the risk of detecting a non-real/spurious effect Typical values are , Reducing the risk of type 1 error increased risk of type 2 error ( reduced Power ) Available Software Standard statistical packages Stata, Minitab, SPSS Sample Power , R Online web calculators Freely available software G* Power Quanto Different packages only perform specific Power calculations so you will need to find one relevant to the statistical model you are planning F2RL3 methylation & smoking Example of an independent two- Sample t-test Breitling et al.
6 AJHG 2011 CpG site mapping to F2RL3 was associated with smoking behaviour Average methylation in smokers was 83% compared to 95% in never smokers How many samples do we need to detect this effect? Power = 90% Significance = Methylation characteristics: means = 83% & 95%, SD = 10% Effect size : difference in means = 95-83 = ] SD 10 G* Power 1. Select the statistical test G* Power 2. Select the type of Power analysis G* Power 3. Input the data characteristics to determine the effect size G* Power 4.
7 Input Power parameters F2RL3 methylation & smoking 1 2 4 3 F2RL3 methylation & smoking 5. Draw plot for a range of values F2RL3 methylation & smoking 5. Draw plot for a range of values F2RL3 methylation & smoking 5. Draw plot for a range of values F2RL3 methylation & smoking 6. Produce of table of values STATA Dialog box STATA 1. Select statistical test and input data characteristics STATA 2. Input Power parameters F2RL3 methylation & smoking > sampsi , sd1( ) sd2( ) alpha( ) Power (.90) Estimated Sample size for two- Sample comparison of means Test Ho: m1 = m2, where m1 is the mean in population 1 and m2 is the mean in population 2 Assumptions: alpha = (two-sided) Power = m1 =.
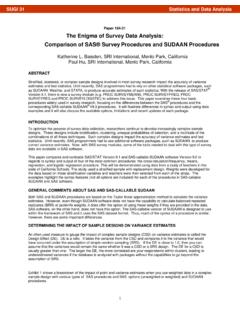
8 95 m2 = .83 sd1 = .1 sd2 = .1 n2/n1 = Estimated required Sample sizes: n1 = 15 n2 = 15 0100200300400 Number of samples per group4681012 Absolute difference in methylation (%) between smokers and non-smokersEqual SD of 10%( Power = , Alpha = ) Sample size requirements0100200300400 Number of samples per group4681012 Absolute difference in methylation (%) between smokers and non-smokersEqual SD of 10%Equal SD of 15%Unequal SD of 15 and 20%( Power = , Alpha = ) Sample size requirementsF2RL3 methylation & smoking > sampsi , sd1( ) sd2( ) alpha( ) n(100)
9 Estimated Power for two- Sample comparison of means Test Ho: m1 = m2, where m1 is the mean in population 1 and m2 is the mean in population 2 Assumptions: alpha = (two-sided) m1 = .9 m2 = .83 sd1 = .15 sd2 = .2 n2/n1 = Estimated Power : Power = . difference in methylation (%) between smokers and non-smokersEqual SD of 10%Equal SD of 15%Unequal SD of 15 and 20%(n = 100, Alpha = ) Power achievedOther statistical tests G* Power Correlations & regressions (univariate, multiple variate, logistic) Means (one, two, many groups, un/paired, non-parametric) Proportions (one, two groups, un/paired) Variances (one, two groups) STATA sampsi (one, two groups, un/paired, means, proportions) fpower (one-way anova) powerreg (regression)
10 Challenges Non-normality of DNA methylation data Can try transform the data Popular transformations don t always work They make interpretation of results more difficult Transformations that modify the data too much can actually lose more Power Can categorise the data Requires more samples given less Power Can perform non-parametric tests Few programs perform non-parametric Power calculations Those that do still assume the data is normally distributed Challenges Non-normality of DNA methylation data there is minimal Power loss associated with the non-parametric tests even when the data are distributed normally, while the Power gains of these tests when normality is violated are substantial (Kitchen, Am J Ophthalmol.)