Transcription of POWER-LAW FITTING AND LOG-LOG GRAPHS - Pomona
1 5 POWER-LAW FITTING AND LOG-LOG GRAPHS She had taken up the idea, she supposed, and made everything bend to it. --- DEALING WITH POWER LAWSA lthough many relationships in nature are linear, some of the most interesting relationships are nonlinear. POWER-LAW dependences, of the formyxkxn()=( )are particularly common. In many cases, we might suspect that two experimental variables are re-lated by a POWER-LAW relationship, but are unsure of what k or n are. For example, we might sus-pect that the period T of a simple harmonic oscillator might depend on the mass m of the oscillating object in some kind of POWER-LAW relationship, but we might be unsure of exactly what the values of either n or k.
2 If we knew n, then we could plot y vs. xn to get a straight line; the slope of that line would then be k. But if we don t know n, it would seem at first glance that the best we could do would be simply try different possible values of n to see what works. This could get old can, however, take advantage of the properties of logarithms to convert any relationship of the type given by equation into a linear relationship, even if we do not know either k or n! The most basic property of logarithms (for any base, but let s assume base-ten logs) is that:log()loglogabab=+( )From this it follows that log()log()loglogloglogaaaaaaanan= =++ +=( )(this is actually true even for non-integer n).
3 Also, in the case of base-ten logarithms, this meanslog()log( )10101bbbb== =( )which shows that raising 10 to a power is the inverse operation to taking the (base-ten) this in mind, let us take the (base-ten) logarithm of both sides of equation and use the properties described by equation If we do this we getloglog()loglogloglogykx kx knxnn==+=+( )Now define andv Substituting these into and rearranging, we get v=+nuklog( )Now, this is the equation of a straight line. This means that if we graph v vs. u (that is, log y vs. log x), we should end up with a straight line, even if we do not know what n and k are.
4 Furthermore,the slope of this line is the unknown exponent n in equation We can there-fore find the value of n by calculating the slope in the usual way. That is,nuyyxx=DD==vvvuu21212121 log loglog log( )n timesn timesThe value of the intercept (which is the value of v=logy when ux=log = 0) is logk, so if we can find the intercept and its uncertainty, we can find k and its summary, we can take any relationship of the form given in equation , take the loga-rithm of both sides, and convert it to a linear relationship whose slope and intercept are related to the unknown values of n and k.
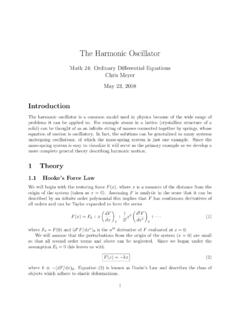
5 This is, therefore, a very powerful way of learning about un-known POWER-LAW relationships (and displaying them). A graph that plots logy versus logx in order to linearize a POWER-LAW relationship is called a LOG-LOG AN EXAMPLE OF A LOG-LOG GRAPHAs an example, consider a hypothetical experiment testing how the period of an object oscil-lating at the end of a spring depends on the object s mass. Table gives a set of measurements taken during this experiment, Figure shows a graph of period vs. the mass. Table shows the base-10 logs of the measurement data, while Figure shows a graph of logT vs.
6 (kg)Period (seconds)246log(mass)log(period) (M)period (T) slog Mlog T : Graph of the oscillation period as a function of : Graph of the log of the oscillationperiod as a function of the log of the can see that the graph of the period vs. the mass does not yield a very good straight line: (if the uncertainties are smaller than the dots representing the data points, we would have to say that a straight line is inconsistent with the data). On the other hand the plot of logT vs. logM is a very nice straight line, suggesting that the period T and the mass M have a POWER-LAW are n and k according to this experiment?
7 We can easily get a quick estimate from the graph. For the sake of round numbers, consider the points marked with s on the graph above. The slope of this graph (rise over run) is thus5. POWER-LAW FITTING and LOG-LOG Graphs3 6nTTMM===log loglog log..2121072 043080 020048( )(The two points that you choose to compute the slope need not correspond to actual data points: simply choose convenient points on your drawn line near the ends of the line. I chose the points so that the denominator of the expression above would be simple.) Since exponents in physical situa-tions are most often integers or simple fractions, we might guess that the actual value of n is 1/2 (this turns out to be the theoretical value as well as we will see chapter N11 in the class text).
8 The intercept is the place where the line crosses the logM = 0 grid line. According to the graph, this is roughly where logT = (note that the logM = 0 line is the right edge of the graph here, not the left!). So the intercept is = log k, which means that k = 10082. = s/kg1 A COMMENT ABOUT LOGARITHMS AND UNITSYou may also have noticed that units seem to spring in and out of these calculations rather haphazardly. This behavior conflicts with a general rule about special functions: the log function, like sine, cosine, and the exponential function, is supposed to have a dimensionless arguments.
9 That is, the number you take the logarithm of is supposed to be a pure number, with no units or di-mensions (like seconds or centimeters), attached to it. What's going on? One can think of a number with units as the product of the number part and the units part; that is, 10 cm is 10 (a pure number) multiplied by the unit of centimeters. When you take the logarithm of a number with units, then, you are taking the logarithm of this product, which behaves like the logarithm of all products: the result is the sum of the logarithms of the two numbers making up the product. The logarithm of 10 cm is therefore log (10) + log cm = 1 + log cm.
10 You can't give a nu-merical result for log cm, which may seem rather , this all works out fine anyway, because you typically find the logarithm of a quantity with units only when you in the process of finding the difference between two logarithms of quantities with the same units. Consider, for example, the situation where we compute the slope using equation If we attach to each logarithm in the numerator the appropriate term of log s (where s is the unit of seconds here), we see that two log s terms cancel out when we subtract, leaving a unitless number in the numerator. The same thing happens in the denominator.

![arXiv:2112.07978v1 [quant-ph] 15 Dec 2021](/cache/preview/0/7/6/9/d/6/0/b/thumb-0769d60b3785b97adb6f78e38f482f6b.jpg)