Transcription of Power Spectral Density - MIT OpenCourseWare
1 CHAPTE R 10 Power Spectral Density INTRODUCTION understanding how the strength of a signal is distributed in the frequency domain, relative to the strengths of other ambient signals, is central to the design of any LTI filter intended to extract or suppress the signal . We know this well in the case of deterministic signals, and it turns out to be just as true in the case of random signals. For instance, if a measured waveform is an audio signal (modeled as a random process since the specific audio signal isn t known) with additive distur bance signals, you might want to build a lowpass LTI filter to extract the audio and suppress the disturbance signals. We would need to decide where to place the cutoff frequency of the filter. There are two immediate challenges we confront in trying to find an appropriate frequency-domain description for a WSS random process. First, individual sample functions typically don t have transforms that are ordinary, well-behaved functions of frequency; rather, their transforms are only defined in the sense of generalized functions.
2 Second, since the particular sample function is determined as the out come of a probabilistic experiment, its features will actually be random, so we have to search for features of the transforms that are representative of the whole class of sample functions, , of the random process as a whole. It turns out that the key is to focus on the expected Power in the signal . This is a measure of signal strength that meshes nicely with the second-moment characteri zations we have for WSS processes, as we show in this chapter. For a process that is second-order ergodic, this will also correspond to the time average Power in any realization. We introduce the discussion using the case of CT WSS processes, but the DT case follows very similarly. EXPECTED INSTANTANEOUS Power AND Power Spectral Density Motivated by situations in which x(t) is the voltage across (or current through) a unit resistor, we refer to x2(t) as the instantaneous Power in the signal x(t). When x(t) is WSS, the expected instantaneous Power is given by 1 Z E[x 2(t)] = Rxx(0) = Sxx(j ) d , ( ) 2 c 183 Alan V.
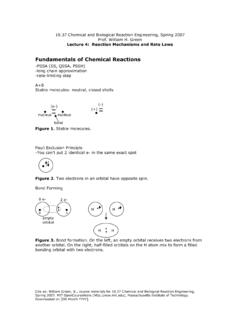
3 Oppenheim and George C. Verghese, 2010 184 Chapter 10 Power Spectral Density where Sxx(j ) is the CTFT of the autocorrelation function Rxx( ). Furthermore, when x(t) is ergodic in correlation, so that time averages and ensemble averages are equal in correlation computations, then ( ) also represents the time-average Power in any ensemble member. Note that since Rxx( ) = Rxx( ), we know Sxx(j ) is always real and even in ; a simpler notation such as Pxx( ) might therefore have been more appropriate for it, but we shall stick to Sxx(j ) to avoid a proliferation of notational conventions, and to keep apparent the fact that this quantity is the Fourier transform of Rxx( ). The integral above suggests that we might be able to consider the expected (in stantaneous) Power (or, assuming the process is ergodic, the time-average Power ) in a frequency band of width d to be given by (1/2 )Sxx(j ) d . To examine this thought further, consider extracting a band of frequency components of x(t) by passing x(t) through an ideal bandpass filter, shown in Figure x(t) H(j ) y(t) H(j ) 1 0 0 FIGURE Ideal bandpass filter to extract a band of frequencies from input, x(t).
4 Because of the way we are obtaining y(t) from x(t), the expected Power in the output y(t) can be interpreted as the expected Power that x(t) has in the selected passband. Using the fact that Syy(j ) = |H(j )|2 Sxx(j ) , ( ) we see that this expected Power can be computed as 1 Z + 1 Z E{y 2(t)} = Ryy(0) = Syy(j ) d = Sxx(j ) d . ( ) 2 2 passband Thus 1 Z Sxx(j ) d ( ) 2 passband is indeed the expected Power of x(t) in the passband. It is therefore reasonable to call Sxx(j ) the Power Spectral Density (PSD) of x(t). Note that the instanta neous Power of y(t), and hence the expected instantaneous Power E[y2(t)], is always nonnegative, no matter how narrow the passband, It follows that, in addition to being real and even in , the PSD is always nonnegative, Sxx(j ) 0 for all . While the PSD Sxx(j ) is the Fourier transform of the autocorrelation function, it Alan V. Oppenheim and George C. Verghese, 2010 cSection Einstein-Wiener-Khinchin Theorem on Expected Time-Averaged Power 185 is useful to have a name for the Laplace transform of the autocorrelation function; we shall refer to Sxx(s) as the complex PSD.
5 Exactly parallel results apply for the DT case, leading to the conclusion that Sxx(ej ) is the Power Spectral Density of x[n]. EINSTEIN-WIENER-KHINCHIN THEOREM ON EXPECTED TIME AVERAGED Power The previous section defined the PSD as the transform of the autocorrelation func tion, and provided an interpretation of this transform. We now develop an alter native route to the PSD. Consider a random realization x(t) of a WSS process. We have already mentioned the difficulties with trying to take the CTFT of x(t) directly, so we proceed indirectly. Let xT (t) be the signal obtained by windowing x(t), so it equals x(t) in the interval ( T , T ) but is 0 outside this interval. Thus xT (t) = wT (t) x(t) , ( ) where we define the window function wT (t) to be 1 for t < T and 0 otherwise. Let | |XT (j ) denote the Fourier transform of xT (t); note that because the signal xT (t) is nonzero only over the finite interval ( T, T ), its Fourier transform is typically well defined. We know that the energy Spectral Density (ESD) Sxx(j ) of xT (t) is given by Sxx(j ) = |XT (j )|2 ( ) and that this ESD is actually the Fourier transform of xT ( ) x T ( ), where x T (t) = xT ( t).
6 We thus have the CTFT pair Z xT ( ) x T ( ) = wT ( )wT ( )x( )x( ) d |XT (j )|2 , ( ) or, dividing both sides by 2T (which is valid, since scaling a signal by a constant scales its Fourier transform by the same amount), 1 Z 1 2 2 TwT ( )wT ( )x( )x( ) d 2T |XT (j )|. ( ) The quantity on the right is what we defined (for the DT case) as the periodogram of the finite-length signal xT (t). Because the Fourier transform operation is linear, the Fourier transform of the expected value of a signal is the expected value of the Fourier transform. We may therefore take expectations of both sides in the preceding equation. Since E[x( )x( )] = Rxx( ), we conclude that 1 Rxx( ) ( ) 2TE[|XT (j )| 2] , ( ) where ( ) is a triangular pulse of height 1 at the origin and decaying to 0 at | | = 2T , the result of carrying out the convolution wT wT ( ) and dividing by c Alan V. Oppenheim and George C. Verghese, 2010 6186 Chapter 10 Power Spectral Density 2T.
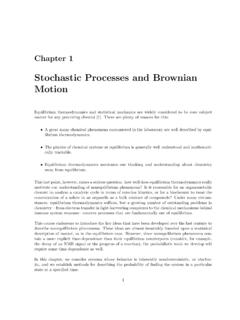
7 Now taking the limit as T goes to , we arrive at the result 1 Rxx SxxT 2TE[|XT (j )| 2] . ( ) ( )(j ) = lim This is the Einstein-Wiener-Khinchin theorem (proved by Wiener, and inde pendently by Khinchin, in the early 1930 s, but as only recently recognized stated by Einstein in 1914). The result is important to us because it underlies a basic method for estimating Sxx(j ): with a given T , compute the periodogram for several realizations of the random process ( , in several independent experiments), and average the results. Increasing the number of realizations over which the averaging is done will reduce the noise in the estimate, while repeating the entire procedure for larger T will improve the frequency resolution of the estimate. System Identification Using Random Processes as Input Consider the problem of determining or identifying the impulse response h[n] of a stable LTI system from measurements of the input x[n] and output y[n], as indicated in Figure x[n] h[n] y[n] FIGURE System with impulse response h[n] to be determined.
8 The most straightforward approach is to choose the input to be a unit impulse x[n] = [n], and to measure the corresponding output y[n], which by definition is the impulse response. It is often the case in practice, however, that we do not wish to or are unable to pick this simple input. For instance, to obtain a reliable estimate of the impulse response in the presence of measurement errors, we may wish to use a more energetic input, one that excites the system more strongly. There are generally limits to the amplitude we can use on the input signal , so to get more energy we have to cause the input to act over a longer time. We could then compute h[n] by evaluating the inverse transform of H(ej ), which in turn could be determined as the ratio Y (ej )/X(ej ). Care has to be taken, however, to ensure that X(ej ) = 0 for any ; in other words, the input has to be sufficiently rich . In particular, the input cannot be just a finite linear combination of sinusoids (unless the LTI system is such that knowledge of its frequency response at a finite number of frequencies serves to determine the frequency response at all frequencies which would be the case with a lumped system, , a finite-order system, except that one would need to know an upper bound on the order of the system so as to have a sufficient number of sinusoids combined in the input).
9 C Alan V. Oppenheim and George C. Verghese, 2010 Section Einstein-Wiener-Khinchin Theorem on Expected Time-Averaged Power 187 The above constraints might suggest using a randomly generated input signal . For instance, suppose we let the input be a Bernoulli process, with x[n] for each n taking the value +1 or 1 with equal probability, independently of the values taken at other times. This process is (strict- and) wide-sense stationary, with mean value 0 and autocorrelation function Rxx[m] = [m]. The corresponding Power Spectral Density Sxx(ej ) is flat at the value 1 over the entire frequency range [ , ]; evidently the expected Power of x[n] is distributed evenly over all frequencies. A process with flat Power spectrum is referred to as a white process (a term that is motivated by the rough notion that white light contains all visible frequencies in equal amounts); a process that is not white is termed colored. Now consider what the DTFT X(ej ) might look like for a typical sample function of a Bernoulli process.
10 A typical sample function is not absolutely summable or square summable, and so does not fall into either of the categories for which we know that there are nicely behaved DTFTs. We might expect that the DTFT exists in some generalized-function sense (since the sample functions are bounded, and therefore do not grow faster than polynomially with n for large n), and this | |is indeed the case, but it is not a simple generalized function; not even as nice as the impulses or impulse trains or doublets that we are familiar with. When the input x[n] is a Bernoulli process, the output y[n] will also be a WSS random process, and Y (ej ) will again not be a pleasant transform to deal with. However, recall that Ryx[m] = h[m] Rxx[m] , ( ) so if we can estimate the cross-correlation of the input and output, we can determine the impulse response (for this case where Rxx[m] = [m]) as h[m] = Ryx[m]. For a more general random process at the input, with a more general Rxx[m], we can solve for H(ej ) by taking the Fourier transform of ( ), obtaining H(ej ) = Syx(ej ).