Transcription of Practical Regression and Anova using R
1 PracticalRegressionandAnova usingRJulianJ. FarawayJuly20021 Copyrightc 1999,2000,2002 JulianJ. FarawayPermissiontoreproduceindividualco piesofthisbookforpersonaluseis a notintroductory. It theessentialsofstatisticalinferencelike estimation, is tolearnwhatmethodsareavailableandmoreimp ortantly, whenthey relativelylessemphasisonmathematicaltheo ry, partlybecausesomepriorknowledgeis importantbecauseit take a widerviewofstatisticaltheory. It is statisticalconceptsarejustasimportantin Statisticsbecausetheseenableusto actuallydoit principlesarehardertolearnbecausethey aredifficulttostatepreciselybutthey a aredesignedfordifferentaudiencesandhave have chosentouseR( (1996)).WhydoI useR? alsoa programminglanguage,soI amnotlimitedbytheproceduresthatareprepro grammedbya is relativelyeasytoprogramnew Dataanalysisis , a time,allowingustomake ,Macintosh, SASis themostcommonstatisticspackageingeneralb utRorS is alsopopularforquantitative thatit is notanintroductiontoR.
2 Thereis a I have Thereadermaychoosetostartworkingthrought histextbeforelearningRandpickit .. a goodestimate?.. Theorem.. 2.. pairofpredictors.. subspace.. 2known.. 2unknown.. 1049 ScaleChanges, .. 13612 ChicagoInsuranceRedlining- a two-level example.. predictors.. Three-level example.. e s theoremformultiplecomparisons.. advantageofRCBD overCRD.. youstartStatisticsstartswitha problem,continueswiththecollectionofdata , is a commonmistake ofinexperiencedStatisticianstoplungeinto a ! problemis formulatetheproblemcorrectly, learnsomethingnewratherthana ,oftenyouwillbeworkingwitha fishingexpeditions - if youlookhardenough,you llalmostalwaysfindsomethingbutthatsometh ingmayjustbea translatedintothelanguageofStatistics,th esolutionis s importanttounderstandhow thedatawascollected. Arethedataobservationalorexperimental?Ar ethedataa sampleofconvenienceorweretheyobtainedvia a designedsamplesurvey.
3 Howthedatawerecollectedhasa crucialimpactonwhatconclusionscanbemade. Is therenon-response?Thedatayoudon t seemaybejustasimportantasthedatayoudosee . Aretheremissingvalues?Thisis a commonproblemthatis troublesomeandtimeconsumingtodealwith. How arethedatacoded?Inparticular, how arethequalitative variablesrepresented. Whataretheunitsofmeasurement?Sometimesda tais collectedorrepresentedwithfarmoredigitst hanarenecessary. Considerroundingif thiswillhelpwiththeinterpretationorstora gecosts. alltoocommon almosta certaintyinany realdatasetofat a lookssimplebutit is vital. Numericalsummaries- means,sds,five-numbersummaries,correlati ons. Graphicalsummaries Onevariable- Boxplots,histogramsetc. Two variables- scatterplots. Many variables- interactive , ,allthedatawillbereadytoanalyzebutyousho uldrealizethatinpracticethisis s andKidney Diseasesconducteda :Numberoftimespregnant,Plasmaglucoseconc entrationa 2 hoursinanoralglucosetolerancetest,Diasto licbloodpressure(mmHg),Tricepsskinfoldth ickness(mm),2-Hourseruminsulin(muU/ml),B odymassindex (weightinkg/(heightinm2)),Diabetespedigr eefunction,Age(years)anda testwhetherthepatientshowssignsofdiabete s(coded0 if negative, 1 if positive).
4 ,beforedoinganythingelse,oneshouldfindou twhatthepurposeofthestudywasandmoreabout how s skipaheadtoa lookat > library(faraway)> data(pima)> pimapregnantglucosediastolictricepsinsul inbmi diabetesage test1614872350 (faraway)makesthedatausedinthisbookavail ablewhiledata(pima) , s toolongtoshow it datasetofthissize,onecanjustaboutvisuall yskimoverthedataforanythingoutofplacebut it is startwithsomenumericalsummaries:> summary(pima)pregnantglucosediastolictri cepsinsulinMin.: : 0 Min.: : : Qu. Qu.:991st Qu. Qu. Qu. : :117 Median: : : :121 Mean: : Qu. Qu.:1403rd Qu. Qu. Qu. :199 Max. : Qu. Qu. Qu. Qu. Qu. Qu. ()commandis a ,wearelookingforanythingunusualorunexpec tedperhapsindicatinga dataentryerror. Forthispurpose,acloselookat theminimumandmaximumvaluesofeachvariable is ,weseea , wethenseethatthenext5 variableshave notgoodforthehealth s lookat thesortedvalues:> sort(pima$diastolic)[1]00 0 0 0 0 00 0 0 0 00 0 0 0 0 0[19]00 0 0 0 0 00 0 0 0 00 0 0 0 0 24[37]30 30 38 4044 44 44 44 46 4648 48 48 48 4850 50 butit seemslikelythatthezerohasbeenusedasa , realinvestigation,onewouldlikelybeableto , A theerrorwaslaterdiscovered,they mightthenblametheresearchersforusing0 asa missingvaluecode(nota goodchoicesinceit is a validvalueforsomeofthevariables)andnotme ntioningit sizeorcomplexity.
5 Setallzerovaluesofthefive variablestoNAwhichis themissingvaluecodeusedbyR.> pima$diastolic[pima$diastolic == 0] <- NA> pima$glucose[pima$glucose == 0] <- NA> pima$triceps[pima$triceps == 0] <- NA> pima$insulin[pima$insulin == 0] <- NA> pima$bmi[pima$bmi == 0] <- NAThevariabletestis notquantitative However,becauseofthenumericalcoding,thisvariablehasbeentreatedasif it s bestto designatesuchvariablesasfactorssothatthey aretreatedappropriately. Sometimespeopleforgetthisandcomputestupidstatisticssuchas averagezipcode .> pima$test<- factor(pima$test)> summary(pima$test)0 1500 268We now seethat500caseswerenegative tousedescriptive labels:> levels(pima$test) <- c("negative","positive")> summary(pima)pregnantglucosediastolictri cepsinsulinMin.: : 44 Min.: : : Qu. Qu.:991st Qu. Qu. : :117 Median: : : :122 Mean: : Qu. Qu.:1413rd Qu. Qu. :199 Max. : s: 5 NA s: :5001st Qu. Qu. :268 Qu.
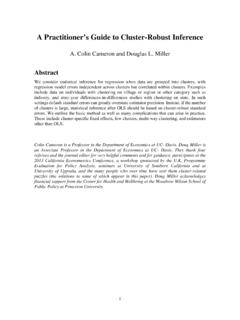
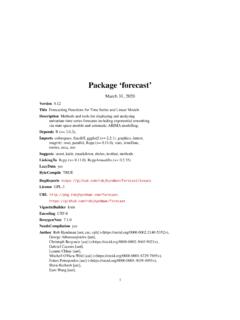
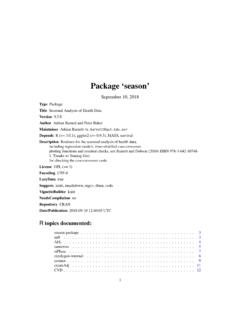
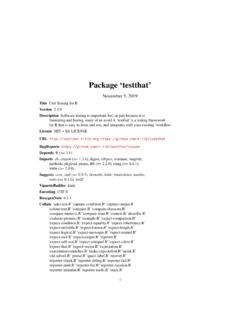
6 Qu. thatwe ve thehistogram:hist(pima$diastolic) $ = 733 Bandwidth = (pima$diastolic) :Firstpanelshowshistogramofthediastolicb loodpressures,thesecondshowsa kerneldensityestimateofthesamewhiletheth ethirdshowsanindex seea ,I prefertouseKernelDensityEstimateswhichar eessentiallya smoothedversionofthehistogram(seeSimonof f (1996)foradiscussionoftherelative meritsofhistogramsandkernelestimates).> plot(density(pima$diastolic, )) seethatit is tosimplyplotthesorteddataagainstitsindex :plot(sort(pima$diastolic),pch=".") canalsoseethediscretenessin themeasurementofbloodpressure- valuesareroundedtothenearestevennumberan dhencewethe steps a :> plot(diabetes diastolic,pima)> plot(diabetes test,pima)hist(pima$diastolic)First,wese ethestandardscatterplotshowingtwo quantitative ,weseea side-by-sideboxplotsuitableforshowinga quantitative anda qualititative a scatterplotmatrix,notshownhere, :Firstpanelshowsscatterplotofthediastoli cbloodpressuresagainstdiabetesfunctionan dthesecondshowsboxplotsofdiastolicbloodp ressurebrokendownbytestresult> pairs(pima)We willbeseeingmoreadvancedplotslaterbutthe numericalandgraphicalsummariespresentedh erearesufficientfora firstlookat usedforexplainingormodelingtherelationsh ipbetweena singlevariableY, calledtheresponse,outputordependentvaria ble,andoneormorepredictor,input,independ entorexplanatoryvariables,X1 Xp.
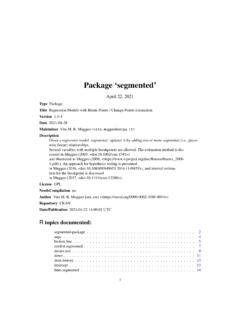
7 Whenp 1,it is calledsimpleregressionbutwhenp 1 it is morethanoneY, thenit is calledmultivariatemultipleregressionwhic hwewon t continuousvariablebuttheexplanatoryvaria blescanbecontinuous,discreteorcategorica lalthoughweleave ,a regressionofdiastolicandbmiondiabeteswou ldbeamultipleregressioninvolvingonlyquan titative variableswhichweshallbetacklingshortly. A regressionofdiastolicandbmiontestwouldin volve onepredictorwhichis quantitative whichwewillconsiderinlaterinthechapteron AnalysisofCovariance. A regressionofdiastoliconjusttestwouldinvo lvejustqualitative predictors,a topiccalledAnalysisof VarianceorANOVA althoughthiswouldjustbea simpletwo regressionoftest(theresponse)ondiastolic andbmi(thepredictors)wouldinvolve a qualitative ,orrelationshipbetween, ,binaryresponses(logisticregressionanaly sis)andcountresponses(poissonregression) . FrancisGaltoncoinedthetermregressiontome diocrityin1875inreferencetothesimpleregr essionequationintheformy ySDy r x x SDx canillustratethiseffectwithsomedataonsco resfroma ,weseea scaleeachvariableto have mean0 andSD1 sothatwearenotdistractedbytherelative ,thissimplifiestheregressionequationtoy rx> data(stat500)> stat500<- (scale(stat500))> plot(final midterm,stat500)> abline(0,1) 2 1012 2 shownwitha dottedlinewhiley xis shownasa have addedthey x(solid) studentscoring,sayonestandarddeviationab ove computetheleastsquaresregressionfitandpl ottheregressionline(moreonthedetailslate r).
8 We alsocomputethecorrelations.> g <- lm(final midterm,stat500)> abline(g$coef,lty=5)> cor(stat500) seethatthethestudentscoring1 SDabove averageonthemidtermis predictedtoscoresomewhatlessabove averageonthefinal(seethedottedregression line)- s above , a studentscoringbelow averageonthemidtermmightexpecttodorelati velybetterinthefinalalthoughstillbelow examsmanagedtomeasuretheabilityofstudent sperfectly, thenprovidedthatabilityremainedun-change dfrommidtermtofinal,wewouldexpecttoseea ,it s toomuchtoexpectsucha perfectexamandsomevariationis ,individualeffortis highscoreonthemidtermcanpartlybeattribut edtoskillbutalsoa bemaintainedin regressionto mediocrity .Ofcoursethisappliestoany x y situationlike this anexampleistheso-calledsophomorejinxinsp ortswhena rookiestarhasa so-sosecondseasonaftera greatfirstyear. Althoughinthefather-sonexample,it doespredictthatsuccessive descendantswillcomeclosertothemean,it otherapplicationsofregression,theregress ioneffectis notofinterestsoit is , s thefuelconsumptionofa discretebutthat s ,say, asa predictorwouldnotbepossiblewithinthecurr entdevelopment(wewillseehow todothislaterinthecourse).
9 Typicallythedatawillbeavailableintheform ofanarraylike thisy1x11x12x13y2x21x22x23 ynxn1xn2xn3wherenis f X1 X2 X3 wherefis someunknownfunctionand is theerrorin thisrepresentationwhichis additive t have enoughdatatotrytoestimatefdirectly, weusuallyhave toassumethatit hassomemorerestrictedform,perhapslineara sinY 0 1X1 2X2 3X3 where i,i 0 1 2 3 areunknownparameters. 0is linearmodeltheparameters enterlinearly thepredictorsdonothave tobelinear. ForexampleY 0 1X1 2logX2 linearbutY 0 1X 21 is forexampley 0x 1 butbecausethepredictorscantransformedand combinedin any way, they ,wemaywriteyi 0 1x1i 2x2i 3x3i ii 1 willfindit simplerbothnotationallyandtheoreticallyt ousea writtenasy X wherey y1 yn T, 1 n T, 0 3 TandX 1x11x12x131x21x22x23 1xn1xn2xn3 , meanonlymodely y1 yn 1 1 1 n We canassumethatE 0 sinceif thiswerenotso,wecouldsimplyabsorbthenon- zeroexpectationfortheerrorintothemean togeta sampleproblemwitha treatmentgrouphavingtheresponsey1 ymwithmean yandcontrolgrouphavingresponsez1 znwithmean zwehave y1 ymz1 zn 10 1001 01 y z 1 m n We have theregressionequationy X - whatestimateof wouldbestseparatethesystematiccom-ponent X fromtherandomcomponent.
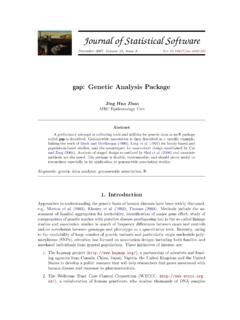
10 Geometricallyspeaking,y IRnwhile IRpwherepis thenumberofparameters(ifweincludetheinte rceptthenpis thenumberofpredictorsplusone). spanned by XFitted in p dimensionsy in n dimensionsResidual inn p :Geometricrepresentationoftheestimation . ThedatavectorY is projectedorthogonallyontothemodelspacesp annedbyX. Thefitis representedbyprojection y X withthedifferencebetweenthefitandthedata representedbytheresidualvector .Theproblemis tofind suchthatX is closetoY. Thebestchoiceof is is insomesensethebestestimateof y X orH ywhereHis denotedby torepresent,asaccuratelyaspossible,somet hingcomplex ywhichisn-dimensional intermsofsomethingmuchsimpler ourmodelis successful,thestructureinthedatashouldbe capturedinthosepdimensions,leavingjustra ndomvariationintheresidualswhichlieinann haveData SystematicStructure RandomVariationndimensions pdimensions n p canbeconsideredfroma non-geometricpointofview. We mightdefinethebestestimateof asthatwhichminimizesthesumofthesquareder rors, T.


![Downloaded by [University of Toronto] at 16:20 23 May 2014 ...](/cache/preview/9/0/c/3/5/7/1/e/thumb-90c3571e5c0834844e82dee36d59b967.jpg)