Transcription of Preparation of - biosearch-cdn.azureedge.net
1 Preparation ofCalibration CurvesA Guide to Best PracticeSeptember 2003 Contact Point:Liz PrichardTel: 020 8943 7553 Prepared by:Vicki BarwickApproved by:_____Date:_____The work described in this report was supported undercontract with the Department of Trade and Industry aspart of the National Measurement System ValidAnalytical Measurement (VAM) ProgrammeMilestone Reference: KT2 LGC Limited 2003 LGC/VAM/2003/032 Page calibration the the the the scatter out regression out regression analysis using the results of the regression of the the calibration function to estimate values for test the uncertainty in predicted error of prediction worked 1: Protocol and results sheet19 Appendix 2: Example set of results25 Appendix 3: Linear regression equations27 LGC/VAM/2003/032 Page 11. IntroductionInstrument calibration is an essential stage in most measurement procedures.
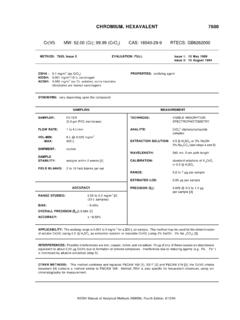
2 It is a set ofoperations that establish the relationship between the output of the measurement system ( ,the response of an instrument) and the accepted values of the calibration standards ( , theamount of analyte present). A large number of analytical methods require the calibration of aninstrument. This typically involves the Preparation of a set of standards containing a knownamount of the analyte of interest, measuring the instrument response for each standard andestablishing the relationship between the instrument response and analyte concentration. Thisrelationship is then used to transform measurements made on test samples into estimates of theamount of analyte present, as shown in Figure 1: Typical calibration curveAs calibration is such a common and important step in analytical methods, it is essential thatanalysts have a good understanding of how to set up calibration experiments and how toevaluate the results August 2002 a benchmarking exercise was undertaken, which involved the preparationand analysis of calibration standards and a test sample using UV spectrophotometry.
3 The aimof the exercise was to investigate the uncertainties associated with the construction of acalibration curve, and with using the calibration curve to determine the concentration of anunknown compound in an aqueous solution. In addition, it was hoped to identify any commonproblems encountered by analysts undertaking calibration of the Environmental Measurement Training Network (EMTN) and the SOCSAA nalytical Network Group (SANG) were invited to participate in the exercise. Five membersof EMTN, six members of SANG and three organisations who are members of both EMTNand SANG submitted results. Some participants submitted results from more than oneanalyst, giving 19 sets of results in total. Full details of the protocol and results sheetcirculated to the laboratories can be found in Appendix 1.
4 Appendix 2 contains an ideal set ofresults from the benchmarking exercise to illustrate how the report should be results of the benchmarking exercise were interesting. Although the exercise initiallyappeared relatively straightforward, a number of mistakes in carrying out the experiments andanalysing the data were identified. Since a number of the mistakes occurred in more than onelaboratory, it is likely that other laboratories carrying out similar exercises may make the = + = /mg L-1 Instrument responsePage 2 LGC/VAM/2003/032 The aim of this guide is to highlight good practice in setting up calibration experiments, and toexplain how the results should be evaluated. The guide focuses on calibration experimentswhere the relationship between response and concentration is expected to be linear, althoughmany of the principles of good practice described can be applied to non-linear software packages such as Excel, it easy to generate a large number of statistics.
5 Theguide also explains the meaning and correct interpretation of some of the statistical termscommonly associated with The calibration ProcessThere are a number of stages in the process of calibrating an analytical instrument. These aresummarised below: Plan the experiments; Make measurements; Plot the results; Carry out statistical (regression) analysis on the data to obtain the calibration function; Evaluate the results of the regression analysis; Use the calibration function to estimate values for test samples; Estimate the uncertainty associated with the values obtained for test guide considers each of these steps in Planning the experimentsThe issues an analyst needs to consider when planning a calibration study are as follows: The number of calibration standards; The concentration of each of the calibration standards; The number of replicates at each concentration; Preparation of the calibration standards;One of the first questions analysts often ask is, How many experiments do I need to do?
6 Due to time and other constrains, this often translates as, What is the absolute minimum I cando? . When thinking about a calibration experiment, this relates to the number of calibrationstandards that need to be analysed, and the amount of replication at each calibration an initial assessment of the calibration function, as part of method validation for example,standards with at least seven different concentrations (including a blank) should be standard concentrations should cover, at least, the range of concentrations encounteredduring the analysis of test samples and be evenly spaced across the range (see Section ).Ideally, the calibration range should be established so that the majority of the test sampleconcentrations fall towards the centre of the range. As discussed in Section , this is thearea of the calibration range where the uncertainty associated with predicted concentrations isat its minimum.
7 It is also useful to make at least duplicate measurements at eachconcentration level, particularly at the method validation stage, as it allows the precision of thecalibration process to be evaluated at each concentration level. The replicates should ideallybe independent making replicate measurements on the same calibration standard gives onlypartial information about the calibration variability, as it only covers the precision of theinstrument used to make the measurements, and does not include the Preparation of 3 Having decided on the number and concentrations of the calibration standards, the analystneeds to consider how best to prepare them. Firstly, the source of the material used to preparethe standards ( , the reference material used) requires careful consideration. The uncertaintyassociated with the calibration stage of any method will be limited by the uncertaintyassociated with the values of the standards used to perform the calibration the uncertainty ina result can never be less than the uncertainty in the standard(s) used.
8 Typically, calibrationsolutions are prepared from a pure substance with a known purity value or a solution of asubstance with a known concentration. The uncertainty associated with the property value( , the purity or the concentration) needs to be considered to ensure that it is fit for matrix used to prepare the standards also requires careful consideration. Is it sufficient toprepare the standards in a pure solvent, or does the matrix need to be closely matched to thatof the test samples? This will depend on the nature of the instrument being used to analyse thesamples and standards and its sensitivity to components in the sample other than the targetanalyte. The accuracy of some methods can be improved by adding a suitable internalstandard to both calibration standards and test samples and basing the regression on the ratioof the analyte response to that of the internal standard.
9 The use of an internal standardcorrects for small variations in the operating the standards should be independent, , they should not be prepared from a commonstock solution. Any error in the Preparation of the stock solution will propagate through theother standards leading to a bias in the calibration . A procedure sometimes used in thepreparation of calibration standards is to prepare the most concentrated standard and thendilute it by, say, 50%, to obtain the next standard. This standard is then diluted by 50% and soon. This procedure is not recommended as, in addition to the lack of independence, thestandard concentrations will not be evenly spaced across the concentration range leading to theproblem of leverage (see Section ).Construction of a calibration curve using seven calibration standards every time a batch ofsamples is analysed can be time-consuming and expensive.
10 If it has been established duringmethod validation that the calibration function is linear then it may be possible to use asimplified calibration procedure when the method is used routinely, for example using fewercalibration standards with only a single replicate at each level. A single point calibration is afast way of checking the calibration of a system when there is no doubt about the linearity ofthe calibration function and the system is unbiased ( , the intercept is not significantlydifferent from zero, see Section ). The concentration of the standard should be equal toor greater than the maximum concentration likely to be found in test there is no doubt about the linearity of the calibration function, but there is a known bias( , a non-zero intercept), a two point calibration may be used. In this case, two calibrationstandards are prepared with concentrations that encompass the likely range of concentrationsfor test there is some doubt about the linearity of the calibration function over the entire rangeof interest, or the stability of the measurement system over time, the bracketing technique maybe useful.