Transcription of Presentation at Nomura Investment Forum 2017 …
1 Connecting Markets East & West Nomura November 29, 2017 Presentation at Nomura Investment Forum 2017 Koji Nagai Group CEO Nomura Holdings, Inc. 050100150 Jan-14 Jul-14 Jan-15 Jul-15 Jan-16 Jul-16 Major European banks CDS (bps)2 : Markit CDX North America High Yield index (5 year) European banks is average of Deutsche Bank, UBS, Credit Suisse, and Barclays (5 year, euro-denominated) 250300350400450500550600 Jan-14 Jul-14 Jan-15 Jul-15 Jan-16 Jul-16US high yield bond credit spread (bps)1 250300350400450500550600 Jan-14 Jan-15 Jan-16 Jan-17US high yield bond credit spread (bps)1 050100150 Jan-14 Jan-15 Jan-16 Jan-17 Major European banks CDS (bps)2 : Markit CDX North America High Yield index (5 year) European banks is average of Deutsche Bank, UBS, Credit Suisse, and Barclays (5 year, euro-denominated) Global economy remains firm : US Department of Labor, Eurostat. World Economic Outlook, October 2017 .
2 Unemployment rate declining in US and Europe1 Strong economic growth expected to continue2 3 0123456 Global Advanced economies Emerging market and developing economies (%) (%) 23456789101112 Jan-14 Jan-15 Jan-16 Jan-17US umemployment rate (%)EU unemployment rate (%)2016 2017 (E) 2018(E) 0102030405060708079818385878991939597990 1030507091113151719010,00020,00030,00040 ,000 Finishing off Abenomics under third longest post-war administration as Japan corporate earnings at record high Corporate earnings at record high Abenomics coming to completion 4 Longest post-wa r administrations 1st 2nd 3rd Productivity revolution Nikkei 225 (rhs) Productivity revolution / intense Investment (3 years) Promote corporate sector capital and personnel Investment Tax / budget / regulatory reform Free higher education Free early childhood education Secure caregiving personnel Russel/ Nomura Large Cap recurring prof it (lhs) Three arrows New three arrows Human resource development revolution Prime Minister Eisaku Sato Shigeru Yoshida Shinzo Abe Days in offic e 2,798 days 2,616 days 2,166 days Period 1964 1972 1946 1954 2006 2007(1st) 2012 present (2nd) (trillions of yen) 5 Progress of Vision C&C Beyond 2020 Post Vision C&C Challenges ahead Environmental changes affecting our business Domestic Retail strategy Environmental changes affecting our business Global Wholesale strategy New growth strategy Driving efficiencies (Corporate operating model) 1 2 Agenda 1.
3 Progress of Vision C&C Management targets 2012 mi d-term management targets 1. March 2020 assumptions: Nikkei 225 at Y25,000; USD/JPY rate Y115; Effective tax rate for Japanese corporates below 30%; Global fee pool annual growth rate of 1%. 7 Announced long-term management vision for 2020 (Vision C&C) Create organization capable of consistently delivering EPS of Y100 1 Establish an operating platform capable of delivering sustainable growth under any environment Improve profitability of international business Transforming business model in Japan Two challenges Sep 2012 Aug 2014 Announced mid-term management targets (EPS Y50) Achieved EPS and other key targets 2 years ahead of schedule Improving Wholesale profitability Reinforce Japan businesses Optimal allocation of resources FY2019/20 FY2014/15 FY2016/17 FY2015/16 .. FY2012/13 FY2013/14 K e y challenges 2012 mi d-term management targets: Achieved all KPIs 8 (as of end Oct 2017 ) Improving Wholesale profitability Reinforce Japan businesses 2012 mid-t e r m management targets EPS Y50 Achieved three times since FY2013/14 Income before income taxes: Y100bn Retail Achieved for three straight years from FY2013/14 Retail client assets: Y100trn (Raised from Y90trn in Dec 2013) Recurring revenue: Consistently achieved since FY2014/15 4Q Asset Management Income before income taxes: Y25bn Achieved for four straight years from FY2013/14 Wholesale Income before income taxes: Y125bn Achieved FY2016/17 of which, international: Y50bn FY2016/17 (Group int l).
4 Additional $1bn cost reduction (total $2bn) Completed Sep 2013 Key KPIs Status (as of Nov 2017 ) Management targets Working towards 2020 Vision C&C 1. March 2020 assumptions: Nikkei 225 at Y25,000; USD/JPY rate Y115; Effective tax rate for Japanese corporates below 30%; Global fee pool annual growth rate of 1%. FY2019/20 FY2014/15 Improve profitability of international business Transforming business model in Japan FY2016/17 FY2015/16 Two challenges Sep 2012 FY2012/13 FY2013/14 Aug 2014 Announced mid-term management targets (EPS Y50) Achieved EPS and other key targets 2 years ahead of schedule Improving Wholesale profitability Reinforce Japan businesses Optimal allocation of resources 9 Announced long-term management vision for 2020 (Vision C&C) Create organization capable of consistently delivering EPS of Y100 1 Establish an operating platform capable of delivering sustainable growth under any environment K e y challenges.
5 FY2019/20 Vision C&C: Key KPIs 1. March 2020 assumptions: Nikkei 225 at Y25,000; USD/JPY rate Y115; Effective tax rate for Japanese corporates below 30%; Global fee pool annual growth rate of 1%. 10 (as of end Oct 2017 ) FY2019/20 management target1 EPS Y100 FY2016/17: Retail Client assets: Y150trn Recurring revenue: Y150bn (cost coverage ratio: Approx. 50%) FY2016/17: (25%) FY2017/18 2Q annualized: (28%) Asset Management Wholesale Fee pool market share: FY2016/17: Key KPIs KPIs as of Nov 2017 KPIs to achieve 2020 long-term management vision AuM: Y55trn (as of end Oct 2017 ) Retail: Client assets 11 FY15/16 KPI (Y90trn) (Sep 2012) Increased KPI to Y100trn (Dec 2013) FY19/20 KPI (Y150trn) (Aug 2014) 150 100 (trillions of yen) rJunSepDecMa rJunSepDecMa rJunSepDecMa rJunSepDecMa rJunSepDecMa rJunSepO ctMa r20 1220 1320 1420 1520 1620 17 20 150 15% 28% 50% -20%-10%0%10%20%30%40%50% revenue(annualized)Recurring revenue cost coverage ratio (rhs)Retail: Steady increase in recurring revenue and recurring revenue cost coverage ratio 12 FY2012/13 FY2013/14 FY2014/15 FY2015/16 FY2016/17 FY2017/ 18 FY2019/20 KPI (billions of yen) FY2015/16 recurring revenue target ( ) Retail.
6 Building platform for consulting services 1. Based on number of domestic transactions introduced or joint brokered by the Real Estate Department. 13 Operating leases 340 10 020 030 005010 0FY2 014/ 15FY2 015/ 16FY2 016/ 17 Amoun t of con tra ctsNum ber of co ntracts (rhs)(billions of yen) Real estate 572 020 040 060 080 00408012 0FY2 014/ 15FY2 015/ 16FY2 016/ 17 Transactio n valu eNum ber of transaction s (rhs)1 1 (billions of yen) 407 010 020 030 040 050 0Ma r- 16Ma r- 17La test(Oct-17)Testam entary trustsEsta te settleme ntsEstate planning Introductions to Nomura Trust & Banking (accumulated) 13 37 60 FY2 014/ 15FY2 015/ 16FY2 016/ 17 Num ber of co mpleted deals(#) (#) SME M&A (#) (#) FY19/20 KPI (Y50trn) (Aug 2014) Increased to Y55trn (May 2017 ) Asset Management: Assets under management 14 (trillions of yen) 55 0102030405060Ma rJunSepDecMa rJunSepDecMa rJunSepDecMa rJunSepDecMa rJunSepDecMa rJunSepO ctMa r20 1220 1320 1420 1520 1620 17 20 20 TargetResults50 Asset Management.
7 Initiatives to boost AuM Enhance solution capabilities to diversify distribution channels Set up organization to target novice investors Establish client base in Australia, Latin America, etc Current businesses Enhance ETF product offering to use as tool for long-term asset building Develop latest technologies and invest in research using seed and pilot funds Increase client base Mutual provision of products with ACI to enhance global presence Consider alliances, investments, acquisitions of asset managers outside Japan Increase product offering 15 Current products Current client base Benefits of collaboration with American Century Investments (ACI) 1. Nomura Corporate Research and Asset Management. 16 Mandates to manage ACI funds In May 2017 , NCRAM1 started managing high yield for ACI target date funds Providing products to ACI distribution channels In Oct 2017 , started distributing NCRAM1 high yield funds to US retail investors via ACI channels Investment trust business In Oct 2016, started offering ACI s Global REIT Fund for Fund Wrap products In Nov 2016, started distributing ACI s US equity funds to retail clients Investment advisory and international business In Sep 2016, started distributing ACI s global equity fund to pension funds Distributing ACI global fixed income fund to international clients AuM: Approx.
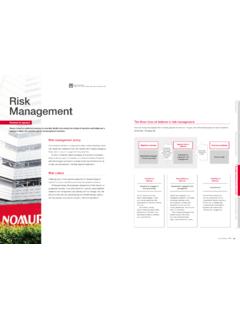
8 Y180bn AuM: Approx. $1bn AuM: Approx. $900m Domestic International Nomura Group American Century Investments Asset Management Division American Century Investments Mutual provision of products, synergies through client introductions Review profitability and resource allocation by strategy to focus on competitive strengths; Profitability improved significantly Wholesale: Continue to review business portfolio 17 FY11/12 FY12/13 FY13/14 FY14/15 FY15/16 FY16/17 Profitability by region and by strategy High (Income before income taxes) Low (L o ss before income taxes) External environment and internal positioning Action plan Core businesses Capital intensive, highly profitable businesses Low profitability, less capital intensive businesses Businesses requiring rebuild Focus on areas of competitive strengths to improve profitability Reduce costs, close certain businesses Shift resources to growth areas Rightsize areas where margins and fee pools are expected to shrink Disciplined Investment to enhance market position Fee pool outlook?
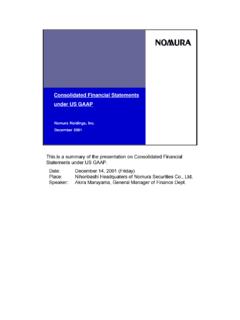
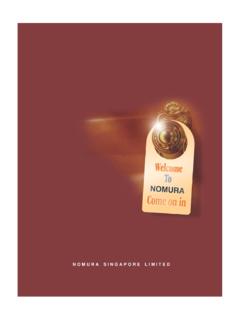
9 Necessary for franchise? Market share, competitive strengths? 7,519 6,879 6,511 6,419 5,871 5,325 FY11/12FY12/13FY13/14FY14/15FY15/16FY16/ 17 Wholesale: Lower costs, manage risk to US$ using month-end spot rate (average) for each year. base assuming business conditions remain unchanged from FY2015/16. Cost reductions centered on fixed costs1 Risk assets trending down 18 (millions of USD) (Indexed, FY2012/13 = 100) Q4 annualized: Approx. $ Apr 2016 target: Approx. 20% reduction Run rate cost target2 Achieved one year ahead Variable costs Fixed costs 100 96 82 72 60 Mar-13 Mar-14 Mar-15 Mar-16 Mar-17 -10%20%30%40%50%<-25-10 to -25-10 to 00 to +10+10 to +25+25 to +50>+50FY16/17-FY17/18 1 HFY12/13-FY15/16 Wholesale daily revenues Wholesale: Strong focus on risk culture 19 Wholesale daily revenues (millions of USD) Percentage of total business days FY12/13 - FY15/16 FY16/17 - FY17/18 1H 92% 97% 8% 3% Positive days Negative days FY12/13 - FY15/16 FY16/17 - FY17/18 1H Positive days Negative days 1H 100 ?
10 ? FY2016/17 FY2015/16 management target (announced in Sep 2012) FY2019/20 management target (announced in Aug 2014) Group performance: Making steady progress 1. Diluted net income per share attributable to Nomura Holdings shareholders. 20 (yen) EPS1 and 2020 management target FY2012/13 FY2013/14 FY2014/15 FY2015/16 FY2019/20 Target FY2017/18 FY2010/11 FY2011/12 FY2017/18 3Q performance (as of Nov) Stock market rally has lifted Retail net revenue to trend slightly above 2Q, while assets under management in Asset Management continue to grow Wholesale roughly unchanged from 2Q Mar-16 Mar-17 Oct- 172020 KPIC hallenges on road to 2020: Retail and securities inflows minus outflows, excluding regional financial institutions. of cash and securities of Retail channels Inflows of Y19trn required to reach Y150trn target, but net inflows of cash and securities not yet at sufficient level 21 Lifting client assets to Y150trn by 2020 Net inflows of cash and securities1 remains a challenge 385 1,076 997 48 -306 -193 FY12/13 FY13/14 FY14/15 FY15/16 FY16/17 FY17/18 1H 281 266 376 301 362 465 (trillions of yen) Market factors Inflows *FY2019/20 assumptions: Nikkei at 25,000; USD/JPY exchange rate at Y115 150 (billions of yen) (billions of yen) Inflows of cash and securities 2 added in Apr 2017 as indicator to evaluate business expansion and has grown steadily Approx.