Transcription of PRESSURE DROP CHARTS - WYE & BASKET …
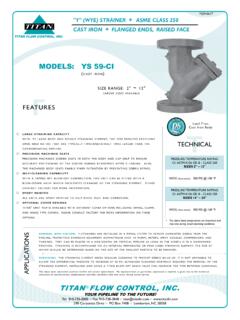
1 STRPDC-0816 TECHNICAL AND PERFORMANCE DATA PRESSURE drop CHARTS f WYE & BASKET STRAINERSTITANTITAN FLOW CONTROL, strainers - Small ModelsWYE strainers - Large ModelsModels: YS12 - YS52 - YS55 - YS56 - YS81 - YS82 Models: YS58 - YS59 - YS54 - YS61 - YS62 - YS63 - YS64 - YS65 Legend: PRESSURE drop - PSI (y - axis) versus Flow Rate - GPM (x -axis)Legend: PRESSURE drop - PSI (y - axis) versus Flow Rate - GPM (x -axis)20 (in) (in) strainers - High PRESSURE - Class 900 &1500 WYE strainers - High PRESSURE - Class 2500 Models: YS66 - YS67 - YS68 - YS69 - YS83 - YS84 Models: YS70 - YS71 - YS85 - YS86 Legend: PRESSURE drop - PSI (y - axis) versus Flow Rate - GPM (x -axis)Legend: PRESSURE drop - PSI (y - axis) versus Flow Rate - GPM (x -axis) 1/41 1/22 1/2 - 346810616323460140180450650930111/2 CvCv2 Sizes (in):5 1/223468 Sizes (in):4210016037560030 CvCvCv These curves are theoretical; actual results may vary depending on installation conditions and other variables.
2 Use these values for reference only. The above PRESSURE drop CHARTS are based upon 1/8" perforated screens and baskets handling clean water at 60 F during ideal inlet and outlet conditions. Therefore, they should only be used for estimation purposes. For fluids other than water, multiply the PRESSURE drop ( P) obtained from the CHARTS by the specific gravity of the fluid in question. For mesh lined screens, multiply the PRESSURE drop ( P) obtained from the CHARTS by the corresponding correction factor shown in the Cv correction : 910-735-0000 s Fax: 910-738-3848 s s Corporate Drive s PO Box 7408 s Lumberton, NC 28358 TITAN FLOW CONTROL, drop Equation for Liquids: P = G (Q / Cv)2 Cr P = PRESSURE drop (psi) G = Specific gravity of liquid Q = Flow rate (GPM)Cv = Flow coefficient factor Cr = Correction factor for mesh and viscositySTRPDC-0816 TECHNICAL AND PERFORMANCE DATA PRESSURE drop CHARTS f WYE & BASKET STRAINERSTITANTITAN FLOW CONTROL, : 910-735-0000 s Fax: 910-738-3848 s s Corporate Drive s PO Box 7408 s Lumberton, NC 28358 TITAN FLOW CONTROL, CORRECTION FACTOR TABLEC entistokes(SSU)Perf.
3 (Unlined)20 MESH40 MESH60 MESH80 MESH100 MESH120 MESH150 MESH200 MESH300 MESH25 Micron10 Micron5 Micron230 (Water) . 82 . 02 .. - -- - -- - . - -- - -- - - - - -- - - -- - -- - - -- - -- - - -- - -- - - -- - -- - - -- - -- - - -- - -- - - -- - -- - - -- - -- - - -- - -- - -- - -- - - -- - -- - -- - -- - -- - - -- - -- - -- - -- - -- - -- - - -- - -- - -- - -- - -- - -- - - -- - -- - -- - -- - -- - -- - -- - -- - -- - -- - - -- - -- - -- - -- - -- - -- - -- - -- - -- - -- - -- - - -- - -- - -- - -- - -- - -- - -- - -- - -- - -- - - -- - -- - -- - -- - -- - -- - -- - -- - -- - -- - -Multiply the Correction Factor by the PRESSURE drop obtained from the CHARTS in order to calculate P for other liquids (besides water) and mesh lined screens and strainers - Threaded Ends & Flanged EndsBasket strainers - Flanged EndsModels: BS25 - BS25F - BS35 - BS35 FModels: BS55 - BS65 - BS85 - BS86 - BS95 Legend.
4 PRESSURE drop - PSI (y - axis) versus Flow Rate - GPM (x -axis)Legend: PRESSURE drop - PSI (y - axis) versus Flow Rate - GPM (x -axis) (in):CvCv23457103/81/23/4141231 1/41 1/24227021 (in):90140290500800160028003700510068008 700109001320045 CvCvPressure drop Equation for Liquids: P = G (Q / Cv)2 Cr P = PRESSURE drop (psi) G = Specific gravity of liquid Q = Flow rate (GPM)Cv = Flow coefficient factor Cr = Correction factor for mesh and viscosity These curves are theoretical; actual results may vary depending on installation conditions and other variables. Use these values for reference only. The above PRESSURE drop CHARTS are based upon 1/8" perforated screens and baskets handling clean water at 60 F during ideal inlet and outlet conditions. Therefore, they should only be used for estimation purposes.
5 For fluids other than water, multiply the PRESSURE drop ( P) obtained from the CHARTS by the specific gravity of the fluid in question. For mesh lined screens, multiply the PRESSURE drop ( P) obtained from the CHARTS by the corresponding correction factor shown in the Cv correction table.