Transcription of PRICE ACTION TRADING - ThinkMarkets
1 PRICE ACTION TRADING 2 | | +44 203 514 2374 Authorised and regulated by the Financial Conduct Authority. Table of Contents Risk Warning.. 3 What is PRICE ACTION TRADING ?.. 4 How to Read a Candlestick Chart.. 5 introduction to the Candlestick.. 6 Trendlines.. 7 Support and Resistance.. 9 Candlestick .. 11 Long Wick .. 11 3 Candle Reversal Patterns.. 15 Checkmate Patterns.. 16 Risk Management in PRICE ACTION TRADING .. 18 Confluence.. 19 Trade Examples.. 19 Reduce Your Learning Curve.. 22 PRICE ACTION TRADING 3 | | +44 203 514 2374 Authorised and regulated by the Financial Conduct Authority. Risk Warning Risk Warning: TRADING forex and Derivatives carries a high level of risk. CFD investors do not own, or have any rights to, the underlying assets.
2 It involves the potential for profit as well as the risk of loss which may vastly exceed the amount of your initial investment and is not suitable for all investors. Please ensure that you fully understand the risks involved, and seek independent advice if necessary. Also, see the section titled Significant Risks in our Product Disclosure Statement, which also includes risks associated with the use of third parties and software plugins. A Financial Services Guide (FSG) and Product Disclosure Statements (PDS) for these products is available from TF GLOBAL MARKETS (AUST) PTY LTD by going to to download at this website or hard copies can be sent by contacting the offices at the number above. The FSG and PDS should be considered before deciding to enter into any Derivative transactions with TF GLOBAL MARKETS (AUST) PTY LTD. The information on this site is not directed at residents in any country or jurisdiction where such distribution or use would be contrary to local law or regulation.
3 2014 TF GLOBAL MARKETS (AUST) PTY LTD. All rights reserved. AFSL 424700. ABN 69 158 361 561. *Free: Items that are indicated as FREE are available without any terms and conditions, with the exception of any promotional offers that have terms and conditions attached. PRICE ACTION TRADING 4 | | +44 203 514 2374 Authorised and regulated by the Financial Conduct Authority. What is PRICE ACTION TRADING ? The PRICE ACTION method of TRADING refers to the practice of buying and selling securities based on the fluctuations, or ACTION , of their prices; typically the data of these PRICE changes is represented in easily-readable candlestick or bar charts, which are the bread and butter of the PRICE ACTION trader. Traditionally, PRICE ACTION traders rely on a naked chart they reject the inclusion of indicators with the conviction that, since all supplemental indicators are necessarily lagging interpretations of the basic data available on the PRICE chart, the ACTION of PRICE is itself the most reliable and accurate indicator.
4 The patterns of PRICE movements reveal in real time the balance between the supply for sale and the buying demand of any given security or currency pair. Any PRICE change implies a shift in the relationship between buyers and sellers; an increase in supply will push PRICE down, whereas an increase in buying demand will send PRICE higher. The PRICE ACTION trader bases their trades on predictions of whether buying demand is greater than the supply of sellers and therefore PRICE is poised to head higher or vice versa. In the forex market, this means that a trader will endeavor to buy (or go long on ) a currency pair when the base currency, the one quoted first, is likely to appreciate against the counter currency, the one listed second; conversely, they will sell (or go short on ) a currency pair wherein they expect the counter currency to appreciate relative to the base currency.
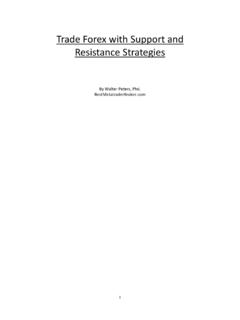
5 In order to make these predictions, PRICE ACTION traders interpret the confluence of many factors, particularly trends, candlestick patterns, and PRICE levels known as support and resistance. This guide is intended to provide an introduction to these interpretive factors, to the risk management practices essential to profitable TRADING , and lastly, some examples of real trades that demonstrate these ideas in ACTION . As such, we ll start with a review of candlesticks and how they are plotted on charts, as this information is the fundamental building block of the science of PRICE ACTION TRADING . PRICE ACTION TRADING 5 | | +44 203 514 2374 Authorised and regulated by the Financial Conduct Authority. The chart at left is a typical naked PRICE chart it contains no information other than the movements of PRICE .
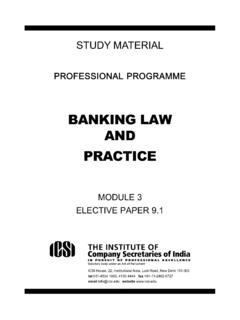
6 As indicated in the top left corner, this is a daily chart of the USDCHF currency pair. Charts can be made on any time scale; on a daily chart, each candlestick the black and white bars placed on the grid corresponds to PRICE s behavior in the span of one day. Likewise, on a 5-minute chart, each candlestick represents 5 minutes of PRICE change. PRICE ACTION TRADING 6 | | +44 203 514 2374 Authorised and regulated by the Financial Conduct Authority. High Upper Shadow/Wick Close Open Open Close Low Lower Shadow/Wick Bullish Candle Bearish Candle The Candlestick Whatever the time scale, each period corresponds to one candle. The candlestick contains four important PRICE levels: the open, close, high, and low. The thick body of the candle indicates the range between the period s opening PRICE and closing PRICE .
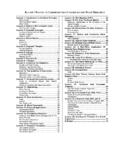
7 On a bullish candle (indicating a PRICE increase over the time period), the open is indicated by the bottom of the body, the close by the top the opposite is true for a bearish candle (indicating a PRICE decrease). The wicks or shadows indicate the range of PRICE s movements during the period. Whenever prices are reached beyond the range bounded by the open and the close, wicks will be visible to indicate the extent of these highs and lows. PRICE ACTION TRADING 7 | | +44 203 514 2374 Authorised and regulated by the Financial Conduct Authority. Trendlines The most general way of describing the behavior of PRICE over time is the trend. A trend is simply the primary direction of PRICE movement in the pertinent window of time. In the daily GBPUSD chart below, PRICE has an obvious uptrend in the 5 month span of the chart.
8 However, this general uptrend contains a number of legs, smaller-scale PRICE trends that necessarily alternate between uptrends and downtrends bullish and bearish legs, respectively. When PRICE remains closely within a diagonal range bounded by two parallel lines, this small PRICE range is often delimited with trend channels, indicating the upper and lower boundaries of the trend. When PRICE moves within a horizontal range without moving in a clear directional trend, the PRICE s ACTION is said to be in the TRADING range. PRICE ACTION TRADING 8 | | +44 203 514 2374 Authorised and regulated by the Financial Conduct Authority. There are a few basic rules to bear in mind when drawing trendlines: 1. Tentative trendline - A diagonal line the market bounces off of twice. This trendline is indicative of a potential trend, but is not confirmed and actionable just yet.
9 2. Confirmed trendline - The market has bounced off this trendline three times. Conventional analysis regards this as a sign that the trendline is real, and that the market will react around it. PRICE ACTION TRADING 9 | | +44 203 514 2374 Authorised and regulated by the Financial Conduct Authority. It is easiest to trade from a trend when its highs or lows hew closely to a recognizable diagonal line, since this line may be used to predict future highs or lows. Opinions vary on whether trendlines should be drawn from the highs and lows of candles or from the body of the candle, the open and close prices; successful traders can be found employing either approach. Support and Resistance The PRICE ACTION trader pays particular attention to pivotal PRICE levels, often drawing these lines horizontally as Support and Resistance levels.
10 The theory behind employing these lines is that the market has a sort of memory: PRICE behaves with respect to certain levels that have previously been significant turning points in the historical narrative of the PRICE s ACTION , and other market participants are likely PRICE ACTION TRADING 10 | | +44 203 514 2374 Authorised and regulated by the Financial Conduct Authority. to also be TRADING with consideration for these levels. When the levels are below the current PRICE , they constitute Support, a potential buffer against bearish movement; when the levels are above the current PRICE , they appear as Resistance, a potential barrier to bullish movement. As PRICE comes close to these levels, traders often wait until the levels have been tested and either broken or defended before they are confident enough in the direction of PRICE s movement to enter into a trade.