Transcription of Price Theory Lecture 2: Supply & Demand - csun.edu
1 Price Theory Lecture 2: Supply & Demand I. The Basic Notion of Supply & Demand Supply -and- Demand is a model for understanding the determination of the Price of quantity of a good sold on the market. The explanation works by looking at two different groups buyers and sellers and asking how they interact. II. Types of Competition The Supply -and- Demand model relies on a high degree of competition, meaning that there are enough buyers and sellers in the market for bidding to take place. Buyers bid against each other and thereby raise the Price , while sellers bid against each other and thereby lower the Price . The equilibrium is a point at which all the bidding has been done; nobody has an incentive to offer higher prices or accept lower prices.
2 Perfect competition exists when there are so many buyers and sellers that no single buyer or seller can unilaterally affect the Price on the market. Imperfect competition exists when a single buyer or seller has the power to influence the Price on the market. The Supply -and- Demand model applies most accurately when there is perfect competition. This is an abstraction, because no market is actually perfectly competitive, but the Supply -and- Demand framework still provides a good approximation for what is happening much of the time. III. The Concept of Demand Used in the vernacular to mean almost any kind of wish or desire or need. But to an economist, Demand refers to both willingness and ability to pay. Quantity demanded (Qd) is the total amount of a good that buyers would choose to purchase under given conditions.
3 The given conditions include: Price of the good income and wealth prices of substitutes and complements population preferences (tastes) expectations of future prices We refer to all of these things except the Price of the good as determinants of Demand . We could talk about the relationship between quantity demanded and any one of these things. But when we talk about a Demand curve, we are focusing on the relationship between quantity demanded and Price (while holding all the others fixed). The Law of Demand states that when the Price of a good rises, and everything else remains the same, the quantity of the good demanded will fall. In short, P Qd Note 1: everything else remains the same is known as the ceteris paribus or other things equal assumption.
4 In this context, it means that income, wealth, prices of other goods, population, and preferences all remain fixed. Of course, in the real world other things are rarely equal. Lots of things tend to change at once. But that s not a fault of the model; it s a virtue. The whole point is to try to discover the effects of something without being confused or distracted by other things. Note 2: Is the law of Demand really a law ? Well, there may be some exceedingly rare exceptions. But by and large the law seems to hold. Note 3: I will use the word normal to refer to any good for which the law of Demand holds. Please note that this is different from the book s definition of normal. A Demand Curve is a graphical representation of the relationship between Price and quantity demanded (ceteris paribus).
5 It is a curve or line, each point of which is a Price -Qd pair. That point shows the amount of the good buyers would choose to buy at that Price . Changes in Demand or shifts in Demand occur when one of the determinants of Demand other than Price changes. In other words, shifts occur when the ceteris are not paribus. The Demand curve s current position depend on those other things being equal, so when they change, so does the Demand curve s position. Examples: 1. The Price of a substitute good drops. This implies a leftward shift. 2. The Price of a complement good drops. This implies a rightward shift. 3. Incomes increase. This implies a rightward shift (for most goods). 4. Preferences change. This could cause a shift in either direction, depending on how preferences change.
6 Demand versus Quantity Demanded. Remember that quantity demanded is a specific amount associated with a specific Price . Demand , on the other hand, is a relationship between Price and quantity demanded, involving quantities demanded for a range of prices. Change in quantity demanded means a movement along the Demand curve. Change in Demand refers to a shift of the Demand curve, caused by something other than a change in Price . IV. The Concept of Supply Used in the vernacular to mean a fixed amount, such as the total amount of petroleum in the world. Again, economists think of it differently. Supply is not just the amount of something there, but the willingness and ability of potential sellers to produce and sell it. Quantity supplied (Qs) is the total amount of a good that sellers would choose to produce and sell under given conditions.
7 The given conditions include: Price of the good prices of factors of production (labor, capital) prices of alternative products the firm could produce technology productive capacity expectations of future prices We refer to all of these, with the exception of the Price of the good, as determinants of Supply . When we talk about Supply , we re talking about the relationship between quantity supplied and the Price of the good, while holding everything else constant. The Law of Supply states that when the Price of a good rises, and everything else remains the same, the quantity of the good supplied will also rise. In short, P Qs A Supply Curve is a graphical representation of the relationship between Price and quantity supplied (ceteris paribus).
8 It is a curve or line, each point of which is a Price -Qs pair. That point shows the amount of the good sellers would choose to sell at that Price . Changes in Supply or shifts in Supply occur when one of the determinants of Supply other than Price changes. Examples: 1. The Price of a factor of production rises. This would cause a leftward shift the Supply curve. 2. A rise in the Price of an alternative good that could be provided with the same resources. This implies a leftward shift of Supply . 3. An improvement in technology. This leads to a rightward shift of Supply . Supply versus Quantity Supplied. Analogous to the Demand versus quantity demanded distinction. Change in quantity supplied means a movement along the Supply curve. Change in Supply refers to a shift of the Supply curve, caused by something other than a change in Price .
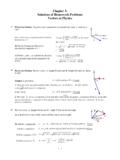
9 V. Constructing the Market Putting Demand and Supply together, we can find an equilibrium where the Supply and Demand curve cross. The equilibrium consists of an equilibrium Price P* and an equilibrium quantity Q*. The equilibrium must satisfy the market-clearing condition, which is Qd = Qs. Mathematical example: Suppose P = 20 - .1Qd and P = 5 + .05Qs. In equilibrium, Qd = Qs, so we have a system of equations. Solve for Q like so: 20 - .1Q = 5 + .05Q 15 = .15Q Q* = 100. Then plug Q* into either equation: P = 20 - .1(100) = 10. So the market equilibrium is P* = 10, Q* = 100. If Price is below P*, at PL, then we have Qd > Qs. This is called excess Demand or shortage. The quantity that actually occurs will be Qs. For this quantity, buyers are willing to pay much more than PL, so they ll start bidding against each and raising the Price .
10 If Price is below P*, at PH, then we have Qs > Qd. This is called excess Supply or surplus. The suppliers will start competing against each other for customers by lowering the Price . Short-side rule: When there is a disequilibrium Price , the actually quantity that gets sold is given by Q = min{Qs,Qd}. This is implied by the requirement of voluntarism. VI. Price Controls Price floors and Price ceilings are government mandated prices that attempt to control the Price of a good or service. DSQPQ*P*PLQsQdA Price ceiling is usually imposed to keep down the Price of something perceived as too expensive. To have any effect, it must be imposed below the market Price . Example: Rent control on apartments. What effect do we predict? As with any below-equilibrium Price in the example above, we expect to get a shortage.