Transcription of Printed on April 25, 2018 RBC Emerging Markets …
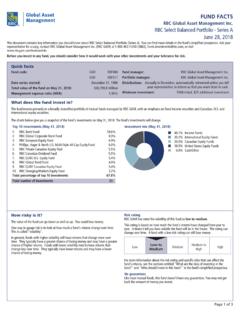
1 Printed on April 25, 2018. RBC Emerging Markets Equity Fund Investment Objective Portfolio Analysis as of March 31, 2018. To provide long-term capital fund invests Asset Mix % Assets Top 25 Holdings % Assets primarily in equity securities of companies located or Cash Naspers Ltd Class N active in Emerging Markets . Fixed Income Taiwan Semiconductor Manufacturing Canadian Equity Housing Development Finance Corp Ltd Fund Details US Equity Tata Consultancy Services Ltd Series Load Structure Currency Fund Code International Equity AIA Group Ltd A No Load CAD RBF499 Other Unilever PLC A No Load USD RBF416 Antofagasta PLC Adv Deferred Sales CAD RBF899 Firstrand Ltd Adv Front End CAD RBF798 Equity Style Equity Statistics Shinhan Financial Group Co Ltd Adv Low Load CAD RBF099 P/B Ratio Credicorp Ltd Large Mid Adv Low Load USD RBF4416 P/E Ratio SM Investments Corp T5 No Load CAD RBF5499 Banco do Brasil SA BB Brasil Avg.
2 Mkt Cap. $B China Mobile Ltd Small Inception Date December 2009 Alibaba Group Holding Ltd ADR Total Fund Assets $Mil 4, Dr Reddy's Laboratories Ltd ADR Series A NAV $ Value Blend Growth Uni-President Enterprises Corp Series A MER % Mondi Ltd Benchmark MSCI Emerging Markets Top 5 Sectors % Equity PT Bank Central Asia Tbk Total Return Net Index ($C). Financials Fuyao Glass Industry Group Co Ltd Information Technology Ping An Insurance (Group) Co of China H Income Distribution Annually Consumer Staples PT Kalbe Farma Tbk Capital Gains Distribution Annually Consumer Discretionary Baidu Inc ADR Materials Enka Insaat Ve Sanayi AS Sales Status Open Min. Investment $ 500 Clicks Group Ltd Subsequent Investment $ 25 Geographic Allocations % Assets Standard Foods Corp China Total % of Top 25 Holdings Fund Category Emerging Markets Equity South Africa Total Number of Stock Holdings 56.
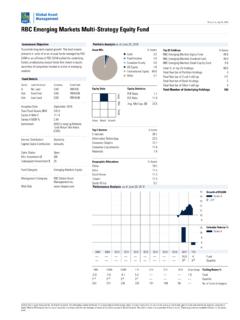
3 Taiwan Total Number of Bond Holdings 0. Management Company RBC Global Asset India Total Number of Other Holdings 1. Management Inc. South Korea Total Number of Holdings 57. Web Site Performance Analysis as of March 31, 2018. 20 Growth of $10,000. Notes 18 Series A. Performance Analysis is in CAD and for CAD series A 16 $17,725. fund (RBF499). 14. 12. 10. 8. 30 Calendar Returns %. Series A. 15. 0. -15. -30. 2008 2009 2010 2011 2012 2013 2014 2015 2016 2017 YTD. Fund 4th 1st 1st 2nd 1st 1st 4th 3rd 4th Quartile 1 Mth 3 Mth 6 Mth 1 Yr 3 Yr 5 Yr 10 Yr Since Incep. Trailing Return %. Fund 2nd 4th 4th 3rd 3rd 1st Quartile 251 250 249 239 157 108 50 No. of Funds in Category 2018. Morningstar Research Inc.
4 All Rights Reserved. The information contained herein: (1) is proprietary to Morningstar and/or its content providers; (2) may not be copied or distributed; and (3) is not warranted to be accurate, complete or timely. Neither Morningstar nor its content providers are responsible for any damages or losses arising from any use of this information. Past performance is no guarantee of future results. These pages are not complete without the disclosure page. Printed on April 25, 2018. RBC Emerging Markets Equity Fund Management Overview Manager Bios Performance Analysis Cont'd as of March 31, 2018. Philippe Langham Distributions ($)/Unit YTD* 2017 2016 2015 2014 2013 2012 2011 2010 2009 2008. RBC Global Asset Management (UK) Limited Total Distributions.
5 Philippe Langham is Head of Emerging Markets Equities Interest . & Senior Portfolio Manager. He has worked in the Dividends . investment industry since 1992 and in 2009 joined RBC Capital Gains . Global Asset Management (UK) Limited to establish and Return Of Capital . lead the team that manages RBC Emerging Markets Equity Fund. Prior to RBC, Philippe was Head of Global Best/Worst Periods % Ended 1 Yr Ended 3 Yr Ended 5 Yr Ended 10 Yr Emerging Markets with Soci t G n rale Asset Best 1-2015 5-2015 5-2017 . Management , August 2007 to August 2009. Philippe Worst 12-2011 9-2013 4-2016 . is a graduate of the University of Manchester in England, Average . where he earned a Bachelor's degree in Economics.
6 He is No. of Periods 88 64 40 . also a qualified Chartered Accountant. Pct. Positive . * Distributions are characterized into income type at year-end. Quarterly Commentary as at March 31, 2018. Emerging Markets continued to outperform selection in China and South Korea detracted from developed Markets in the quarter. January's strong returns; however, this was somewhat offset by performance, supported by gains in the strong stock selection in India. Information Technology sector, was reversed in February after a global sell-off in equities as The biggest contributors to relative returns during tensions rose amid trade protectionism and a the quarter were Brazilian bank, Banco Bradesco;. possible trade war.
7 Peruvian bank, Credicorp Ltd.; and the Chinese At the country level, Brazil and Peru were the best- leader in video surveillance, Hangzhou Hikvision performing Markets , both buoyed by a positive Digital Technology Co. Ltd. political environment while the Philippines, Poland and India were the worst-performing Markets . At Naspers, the South African media conglomerate, the sector level, Energy and Health Care were the was among the biggest detractors during the best-performing sectors while Consumer quarter. SM Investments, the conglomerate often Discretionary and Telecommunication Services seen as a proxy to the Philippines market , also were the worst. detracted from performance. In addition, we sold At the sector level, stock selection in Health Care Samsung Electronics Co.
8 Ltd. in February due to and Industrials detracted from returns, particularly increasing concerns about corporate governance, our holdings in Dr. Reddy's Laboratories and SM but this hurt relative performance as the stock Investments Corp. At the country level, stock rebounded in March. 2018. Morningstar Research Inc. All Rights Reserved. The information contained herein: (1) is proprietary to Morningstar and/or its content providers; (2) may not be copied or distributed; and (3) is not warranted to be accurate, complete or timely. Neither Morningstar nor its content providers are responsible for any damages or losses arising from any use of this information. Past performance is no guarantee of future results.
9 These pages are not complete without the disclosure page. Printed on April 25, 2018. RBC Emerging Markets Equity Fund Disclosure RBC Funds, BlueBay Funds, PH&N Funds and implied, are made by RBC GAM, its affiliates investment of any fund. RBC Corporate Class Funds are offered by or any other person as to its accuracy, RBC Global Asset Management Inc. and completeness or correctness. All opinions The fund profile is provided for informational distributed through authorized dealers. and estimates constitute RBC GAM's purposes only. Particular investments and/or judgment as of the date of this document, are trading strategies should be evaluated Commissions, trailing commissions, subject to change without notice and are relative to each individual's investment management fees and expenses all may be provided in good faith but without legal objectives.
10 The information contained in the associated with mutual fund investments. responsibility. The Top Ten/25 Holdings may fund profile is not, and should not be Please read the prospectus or Fund Facts change due to ongoing portfolio transactions construed as, investment or tax advice. You document before investing. Except as within the fund. The Prospectus and other otherwise noted, the indicated rates of return information about the underlying investment should not act or rely on the information are the historical annual compounded total funds are available at contained in the fund profile without seeking returns including changes in unit value and the advice of an appropriate professional reinvestment of all distributions and do not MER (%) for RBC Funds, PH&N Funds and advisor.