Transcription of Printed on July 19, 2018 RBC Quant Emerging ... - …
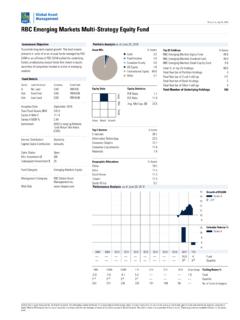
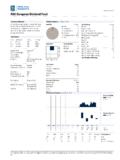
1 Printed on October 16, 2018 2018. Morningstar Research Inc. All Rights Reserved. The information contained herein: (1) is proprietary to Morningstar and/or its content providers; (2) may not be copied or distributed; and (3) is not warranted to be accurate, complete ortimely. Neither Morningstar nor its content providers are responsible for any damages or losses arising from any use of this information. Past performance is no guarantee of future results. These pages are not complete without the Quant Emerging Markets Dividend Leaders ETF (USD Units) ObjectiveThe fund seeks to provide unitholders with exposure tothe performance of a diversified portfolio of high-qualityemerging market dividend-paying equity securities thatwill provide regular income and that have the potentialfor long-term capital ExchangeTSXI nception DateOctober 22, 2014 CurrencyUS DollarNet Assets $ Outstanding200,000 NAV / Price / Fee % % DistributionMonthlyCapital Gains DistributionAnnuallyDistribution Yield % Distribution Yield % CompanyRBC Global AssetManagement (722-3837)
2 Reasons to invest Attractive dividend yield with long-term growthpotential Quantitative multi-factor approach used to gauge acompany s financial strength Emphasizes consistent and growing dividend payersPortfolio Analysisas of September 30, 2018 Sectors% Allocations% Average Dividend Average Price to Average Price to Average Market Cap ($M)17, Average Capitalization% 25 Holdings% AssetsSamsung Electronics Co MSCI Emerging Markets Consultancy Services Construction Bank Corp An Insurance (Group) Co of China Petroleum & Chemical Corp H Of China Ltd Unibanco Holding PCL Financiero Banorte SAB de CV Cl Merchants Bank Co Ltd Class Telecom Co Telekomunikasi Indonesia Tbk Class Mahindra Financial Holding Co Bank of China Ltd Petrochemical Koncern Naftowy ORLEN Bank Group Financial Holdings Co Rakyat Indonesia (Persero)
3 Tbk Cl % of Top 25 Number of Portfolio Holdings1,025 Performance Analysis as of September 30, 201878910111213 Growth of $10,000$9,727-30-15015302008 2009 2010 2011 2012 2013 2014 Returns %Fund1 Mth3 Mth6 Mth1 Yr3 Yr5 Yr10 YrSince Return % on October 16, 2018 2018. Morningstar Research Inc. All Rights Reserved. The information contained herein: (1) is proprietary to Morningstar and/or its content providers; (2) may not be copied or distributed; and (3) is not warranted to be accurate, complete ortimely. Neither Morningstar nor its content providers are responsible for any damages or losses arising from any use of this information.
4 Past performance is no guarantee of future results. These pages are not complete without the Quant Emerging Markets Dividend Leaders ETF (USD Units) as of September 30, 2018 Distributions ($)/UnitYTD*2017201620152014201320122011 201020092008 Total Interest Dividends Capital Gains Return Of Capital * Distributions are characterized into income type at ETFs are offered by RBC Global Asset Management Inc. and distributed through authorized dealers. Commissions, management fees and expenses all may be associated withinvestments in exchange-traded funds (ETFs).
5 Please read the prospectus or Fund Facts before investing. ETFs are not guaranteed, their values change frequently and pastperformance may not be repeated. ETF units are bought and sold at market price on a stock exchange and brokerage commissions will reduce returns. RBC ETFs do not seek to returnany predetermined amount at maturity. Index returns do not represent RBC ETF returns. RBC ETFs are managed by RBC Global Asset Management Inc., an indirect wholly-ownedsubsidiary of Royal Bank of Canada. Except as otherwise noted, the indicated rates of return are the historical total returns for the periods including changes in unit value andreinvestment of all distributions and do not take into account sales, redemption, commission charges or income taxes payable by any unitholder that would have reduced document has been compiled by RBC Global Asset Management Inc.
6 (RBC GAM) from sources believed to be reliable, but no representations or warranty, express or implied, aremade by RBC GAM, its affiliates or any other person as to its accuracy, completeness or correctness. All opinions and estimates constitute RBC GAM's judgment as of the date of thisdocument, are subject to change without notice and are provided in good faith but without legal (%) is based on actual expenses for the half-year period, January 1 to June 30, 2018, expressed on an annualized are only used to illustrate the effects of the compound growth rate and do not reflect future values of any fund or returns on investment of any fund.
7 The fund profile isprovided for informational purposes only. Particular investments and/or trading strategies should be evaluated relative to each individual s investment objectives. The informationcontained in the fund profile is not, and should not be construed as, investment or tax advice. You should not act or rely on the information contained in the fund profile withoutseeking the advice of an appropriate professional RBC ETFs referred to herein have been developed solely by RBC rights in FTSE Canada Universe + Maple Short Term Overall Bond Index and FTSE Canada Universe + Maple Bond Index, FTSE Canada 2018 Maturity Corporate Bond Index, FTSEC anada 2019 Maturity Corporate Bond Index, FTSE Canada 2020 Maturity Corporate Bond Index, FTSE Canada 2021 Maturity Corporate Bond Index, FTSE Canada 2022 MaturityCorporate Bond Index, FTSE Canada 2023 Maturity Corporate Bond Index.
8 FTSE Canada 2024 Maturity Corporate Bond Index and FTSE Canada 2025 Maturity Corporate Bond Index(collectively, the FTSE GDCM Indices ) vest in FTSE Global Debt Capital Markets Inc. All rights in FTSE Canada All Cap Domestic Index, FTSE USA Index, FTSE Developed ex NorthAmerica Index and FTSE Emerging Index (collectively, the FTSE International Indices ) vest in FTSE International Limited ( FTSE ). All rights in the FTSE World Government BondIndex (Currency-Hedged in CAD) (the FTSE FI Index ) vest in FTSE Fixed Income LLC. FTSE is a trade mark of the relevant London Stock Exchange Group ( LSEG ) company and isused under license.
9 The FTSE GDCM Indices, the FTSE International Indices and the FTSE FI Index (together, the FTSE Indices ) are calculated by FTSE Global Debt Capital MarketsInc., FTSE International Limited, and FTSE Fixed Income LLC, respectively, or their agents, as applicable. The LSEG companies, FTSE Global Debt Capital Markets Inc., FTSEI nternational Limited, and FTSE Fixed Income LLC, and their licensors (collectively, the FTSE Licensors ) are not connected to and do not sponsor, advise, recommend, endorse orpromote the ETFs and do not accept any liability whatsoever to any person arising out of (a) the use of, reliance on or any error in the FTSE Indices or (b) investment in or operation ofthe ETFs.
10 The FTSE Licensors make no claim, prediction, warranty or representation either as to the results to be obtained from the ETFs or the suitability of the FTSE Indices, for thepurpose to which they are being put by RBC RBC ETF referred to herein is not sponsored, endorsed, or promoted by MSCI Inc., and MSCI Inc. bears no liability with respect to the ETF or any index on which the ETF is GAM licenses the use of the MSCI index and is not affiliated with MSCI Inc. The ETF s prospectus contains a more detailed description of the limited relationship MSCI Inc. haswith RBC GAM and the Canada Bank Yield Index, Solactive Banks Yield Index and Solactive Banks Yield (CAD Hedged) Index are calculated and published by Solactive AG.