Transcription of Printed on July 24, 2018 RBC Emerging Markets Multi ...
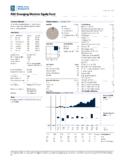
1 Printed on July 24, 2018. RBC Emerging Markets Multi -Strategy Equity Fund Investment Objective Portfolio Analysis as of June 30, 2018. To provide long-term capital growth. The fund invests Asset Mix % Assets Top 25 Holdings % Assets primarily in units of other mutual funds managed by RBC Cash RBC Emerging Markets Equity Fund GAM or an affiliate of RBC GAM (called the underlying Fixed Income RBC Emerging Markets Dividend Fund funds), emphasizing mutual funds that invest in equity Canadian Equity RBC Emerging Markets Small-Cap Eq Fund securities of companies located or active in Emerging US Equity Total % of Top 25 Holdings Markets . International Equity Total Number of Portfolio Holdings 4.
2 Other Total Number of Stock Holdings 177. Fund Details Total Number of Bond Holdings 2. Series Load Structure Currency Fund Code Total Number of Other Holdings 4. A No Load CAD RBF438 Equity Style Equity Statistics Total Number of Underlying Holdings 183. Adv Front End CAD RBF6438 P/B Ratio Large Mid Adv Low Load CAD RBF4438 P/E Ratio Avg. Mkt Cap. $B Inception Date September 2016. Small Total Fund Assets $Mil Series A NAV $ Series A MER % Value Blend Growth Benchmark MSCI Emerging Markets Total Return Net Index (CAD) Top 5 Sectors % Equity Financials Income Distribution Quarterly Information Technology Capital Gains Distribution Annually Consumer Staples Consumer Discretionary Sales Status Open Materials Min.
3 Investment $ 500. Subsequent Investment $ 25 Geographic Allocations % Assets China Fund Category Emerging Markets Equity India South Korea Management Company RBC Global Asset Taiwan Management Inc. South Africa Web Site Performance Analysis as of June 30, 2018. 15 Growth of $10,000. 14 Series A. 13 $11,417. 12. 11. 10. 9. 24 Calendar Returns %. Series A. 16. 8. 0. -8. 2008 2009 2010 2011 2012 2013 2014 2015 2016 2017 YTD. Fund 3rd 3rd Quartile 1 Mth 3 Mth 6 Mth 1 Yr 3 Yr 5 Yr 10 Yr Since Incep. Trailing Return %. Fund 2nd 2nd 3rd 3rd Quartile 243 237 236 232 151 109 56 No. of Funds in Category 2018. morningstar Research Inc. All Rights Reserved. The information contained herein: (1) is proprietary to morningstar and/or its content providers; (2) may not be copied or distributed; and (3) is not warranted to be accurate, complete or timely.
4 Neither morningstar nor its content providers are responsible for any damages or losses arising from any use of this information. Past performance is no guarantee of future results. These pages are not complete without the disclosure page. Printed on July 24, 2018. RBC Emerging Markets Multi -Strategy Equity Fund Management Overview Manager Bios Performance Analysis Cont'd as of June 30, 2018. Philippe Langham Distributions ($)/Unit YTD* 2017 2016 2015 2014 2013 2012 2011 2010 2009 2008. RBC Global Asset Management (UK) Limited Total Distributions . Philippe is Head of Emerging Markets Equities & Senior Interest . Portfolio Manager. He has worked in the investment Dividends.
5 Industry since 1992 and joined the firm in 2009 to Capital Gains . establish and lead the team that manages the Emerging Return Of Capital . Markets equity strategies. Prior to RBC, Philippe was Head of Global Emerging Markets with Soci t G n rale Best/Worst Periods % Ended 1 Yr Ended 3 Yr Ended 5 Yr Ended 10 Yr Asset Management Philippe holds a Bachelor's Best 1-2018 . degree in Economics from the University of Manchester Worst 5-2018 . and is a qualified Chartered Accountant. Average . No. of Periods 10 . Laurence Bensafi Pct. Positive . RBC Global Asset Management (UK) Limited * Distributions are characterized into income type at year-end. Laurence Bensafi is Deputy Head, Emerging Markets Equities.
6 Prior to joining the firm in 2013, Laurence was Quarterly Commentary as at June 30, 2018. responsible for managing global Emerging Markets income funds and developing quantitative stock selection The Fund's three investments had a negative positive territory. Brazil, Turkey and Pakistan were and environmental analysis models. Laurence is a CFA impact on returns, with the RBC Emerging Markets the worst performers. charterholder and a graduate of Toulouse University Dividend Fund performing the worst. (France), where she obtained a Magist re d' conomiste In the RBC Emerging Market Equity Fund, Banco do Statisticien & Statistique et conom trie. Emerging -market equities posted significant losses in the second quarter of 2018, marking their worst Brasil was the stock that held back returns the quarter since 2015.
7 Geopolitics replaced central- most, as did not owning Tencent, the Chinese bank actions as the most important driver of global internet company. Banco do Brasil also held back Markets , as relations with North Korea see- returns the most in the RBC Emerging Markets sawed and trade tensions between the and Dividend Fund, while returns in the RBC Emerging China escalated. All sectors finished the quarter in Markets Small-Cap Equity Fund were limited by negative territory, with defensive sectors outperforming cyclical ones, particularly in June. exposure to Duratex, a Brazilian manufacturer of At the country level, Colombia and Qatar were the construction materials, and a lack of exposure to only Emerging Markets to finish the quarter in Walsin Technology of Taiwan.
8 2018. morningstar Research Inc. All Rights Reserved. The information contained herein: (1) is proprietary to morningstar and/or its content providers; (2) may not be copied or distributed; and (3) is not warranted to be accurate, complete or timely. Neither morningstar nor its content providers are responsible for any damages or losses arising from any use of this information. Past performance is no guarantee of future results. These pages are not complete without the disclosure page. Printed on July 24, 2018. RBC Emerging Markets Multi -Strategy Equity Fund Disclosure RBC Funds, BlueBay Funds, PH&N Funds and implied, are made by RBC GAM, its affiliates RBC Corporate Class Funds are offered by or any other person as to its accuracy, The fund profile is provided for informational RBC Global Asset Management Inc.
9 And completeness or correctness. All opinions purposes only. Particular investments and/or distributed through authorized dealers. and estimates constitute RBC GAM's trading strategies should be evaluated judgment as of the date of this document, are relative to each individual's investment Commissions, trailing commissions, subject to change without notice and are objectives. The information contained in the management fees and expenses all may be provided in good faith but without legal associated with mutual fund investments. responsibility. The Top Ten/25 Holdings may fund profile is not, and should not be Please read the prospectus or Fund Facts change due to ongoing portfolio transactions construed as, investment or tax advice.
10 You document before investing. Except as within the fund. The Prospectus and other should not act or rely on the information otherwise noted, the indicated rates of return information about the underlying investment contained in the fund profile without seeking are the historical annual compounded total funds are available at the advice of an appropriate professional returns including changes in unit value and advisor. reinvestment of all distributions and do not MER (%) for RBC Funds, PH&N Funds and take into account sales, redemption, BlueBay Funds is based on actual expenses Quartile rankings are determined by distribution or optional charges or income for the full year period, January 1 to morningstar Research Inc.