Transcription of Printed on July 24, 2018 RBC European Dividend Fund
1 Printed on June 13, 2018 2018. Morningstar Research Inc. All Rights Reserved. The information contained herein: (1) is proprietary to Morningstar and/or its content providers; (2) may not be copied or distributed; and (3) is not warranted to be accurate, complete ortimely. Neither Morningstar nor its content providers are responsible for any damages or losses arising from any use of this information. Past performance is no guarantee of future results. These pages are not complete without the European Dividend FundInvestment ObjectiveTo provide long-term total returns consisting of regulardividend income and modest capital growth. The fundinvests primarily in common and preferred equitysecurities of major European companies with aboveaverage Dividend DetailsSeriesLoad StructureCurrencyFund CodeANo LoadCADRBF471 AdvFront EndCADRBF6471 AdvLow LoadCADRBF031 Inception DateAugust 2014 Total fund Assets $ A NAV $ A MER % Europe Total ReturnNet Index ($C)Income DistributionQuarterlyCapital Gains DistributionAnnuallySales StatusOpenMin.
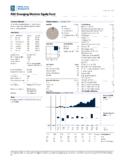
2 Investment $500 Subsequent Investment $25 fund CategoryEuropean EquityManagement CompanyRBC Global AssetManagement Analysisas of May 31, 2018 Asset Mix% StyleValueBlendGrowthLargeMidSmallEquity StatisticsP/B Mkt Cap. $ 5 Sectors% Allocations% AssetsUnited 10 Holdings% AssetsRELX NV Dutch Shell PLC Holding AG Dividend Right American Tobacco Groep Tinto % of Top 10 Number of Stock Holdings46 Total Number of Bond Holdings0 Total Number of Other Holdings1 Total Number of Holdings47 Performance Analysis as of May 31, 20189101112131415 Growth of $10,000 Series A$11,677-20-10010202008 2009 2010 2011 2012 2013 2014 Returns %Series AFundQuartile1 Mth3 Mth6 Mth1 Yr3 Yr5 Yr10 YrSince Return % Quartile1771751751731167755 No.
3 Of Funds in CategoryPrinted on June 13, 2018 2018. Morningstar Research Inc. All Rights Reserved. The information contained herein: (1) is proprietary to Morningstar and/or its content providers; (2) may not be copied or distributed; and (3) is not warranted to be accurate, complete ortimely. Neither Morningstar nor its content providers are responsible for any damages or losses arising from any use of this information. Past performance is no guarantee of future results. These pages are not complete without the European Dividend FundManagement OverviewManager BiosJames JamiesonRBC Global Asset Management (UK) LimitedJames is a Portfolio Manager with the European Equityteam of RBC Global Asset Management (UK) Limited.
4 Heco-manages both the European Equity strategy and theEuropean Dividend strategy. James began his careerwith S&W Investment Management in the graduateprogram in 2008. He ultimately joined RBC Global AssetManagement as an Associate Portfolio Manager inJanuary 2014. James graduated from Imperial College in2008 with a First Class BSc (Hons) degree in AppliedBusiness, holds the Chartered MCSI and is a WallingtonRBC Global Asset Management (UK) LimitedDominic has worked in the investment industry since1991 and has been a portfolio manager since 1993. Priorto joining RBC Global Asset Management (UK) Limited,he worked for Invesco Perpetual. Between 2002 and July2007, Dominic ran several Continental European equityfunds for individual investors and institutions.
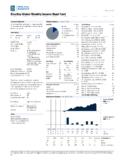
5 He has aMasters in Finance and Investment from the University ofExeter. Dominic also holds the Securities InstituteDiploma and is a Fellow of the Securities Analysis Cont'd as of May 31, 2018 Distributions ($)/UnitYTD*2017201620152014201320122011 201020092008 Total Dividends Capital Gains Return Of Capital EndedEndedEndedEnded12-201510-2017 11-20165-2018 Best/Worst Periods %1 Yr3 Yr5 Yr10 No. of Periods3410 Pct. * Distributions are characterized into income type at Commentary as at March 31, 2018 European equities fell during the quarter asvolatility returned to markets after strongperformance in around the globe felt the effects of a risein protectionist policies, resulting in fears of atrade war emanating from the United States.
6 Thiswas accompanied by signs of a slowdown inEuropean economic growth. The positive economicgrowth predicted for 2018 has not materialized sofar, resulting in a reversal of the cyclical stockmomentum as investors revert to more Italian elections in early March yielded noclear victor as the Five Star Movement became thesingle largest party with 32% of the vote. TheLega Nord party eclipsed Silvio Berlusconi s ForzaItalia by winning 17% of the vote, leaving thecountry to form a coalition a sector level, all sectors posted negativereturns with Telecommunication Services thedeepest in the red. Defensive sectors rallied inMarch with Utilities, Consumer Staples and HealthCare all posting positive returns, but were downoverall during the best-performing stocks in the portfolio werethe London Stock Exchange Group plc and clothingretailer, Next plc, while software company, MicroFocus International plc, and British AmericanTobacco plc were the largest drags competing headwinds and tailwindsremain as valuation polarization and politicalinstability compete with positive earnings pershare and GDP forecasts, although these tend tobe lagging indicators.
7 Question marks remain overthe final composition of the Italian governmentand the ability of French President Macron to pushthrough his labour reforms. However, our focusremains on the discipline of long-term investing incompanies with strong competitive positions, lowcapital intensity, sustainable and/or on June 13, 2018 2018. Morningstar Research Inc. All Rights Reserved. The information contained herein: (1) is proprietary to Morningstar and/or its content providers; (2) may not be copied or distributed; and (3) is not warranted to be accurate, complete ortimely. Neither Morningstar nor its content providers are responsible for any damages or losses arising from any use of this information.
8 Past performance is no guarantee of future results. These pages are not complete without the European Dividend FundDisclosureRBC Funds, BlueBay Funds, PH&N Funds andRBC Corporate Class Funds are offered byRBC Global Asset Management Inc. anddistributed through authorized , trailing commissions,management fees and expenses all may beassociated with mutual fund read the prospectus or fund Factsdocument before investing. Except asotherwise noted, the indicated rates of returnare the historical annual compounded totalreturns including changes in unit value andreinvestment of all distributions and do nottake into account sales, redemption,distribution or optional charges or incometaxes payable by any unitholder that wouldhave reduced returns.
9 Mutual funds are notguaranteed or covered by the CanadianDeposit Insurance Corporation or by any othergovernment deposit insurer. For moneymarket funds, there can be no assurancesthat the fund will be able to maintain its netasset value per unit at a constant amount orthat the full amount of your investment in thefund will be returned to you. The value ofmutual funds change frequently and pastperformance may not be document has been compiled by RBCG lobal Asset Management Inc. (RBC GAM)from sources believed to be reliable, but norepresentations or warranty, express orimplied, are made by RBC GAM, its affiliatesor any other person as to its accuracy,completeness or correctness. All opinionsand estimates constitute RBC GAM'sjudgment as of the date of this document, aresubject to change without notice and areprovided in good faith but without legalresponsibility.
10 The Top Ten/25 Holdings maychange due to ongoing portfolio transactionswithin the fund . The Prospectus and otherinformation about the underlying investmentfunds are available at (%) for RBC Funds, PH&N Funds andBlueBay Funds is based on actual expensesfor the full year period, January 1 toDecember 31, 2017, expressed on anannualized (%) for RBC Corporate Class Funds isbased on actual expenses for the half-yearperiod, April 1, to September 30, 2017,expressed on an annualized H and Series I are not available forpurchase by new investors. Existinginvestors who hold Series H or Series I unitscan continue to make additional investmentsinto the same series of the funds they are only used to illustrate the effectsof the compound growth rate and do notreflect future values of any fund or returns oninvestment of any fund profile is provided for informationalpurposes only.