Transcription of PROBIT AND ORDERED PROBIT ANALYSIS OF THE DEMAND …
1 PROBIT AND ORDERED PROBIT ANALYSIS OF THE DEMAND FOR FRESH SWEET CORN By AMANDA C. BRIGGS A THESIS PRESENTED TO THE GRADUATE SCHOOL OF THE UNIVERSITY OF FLORIDA IN PARTIAL FULFILLMENT OF THE REQUIREMENTS FOR THE DEGREE OF MASTER OF SCIENCE UNIVERSITY OF FLORIDA 2003 ACKNOWLEDGMENTS There are several people I would like to thank for helping me complete this thesis and contributing to my graduate experience at the University of Florida. I extend my gratitude to my committee chair, Dr. Robert L. Degner; and committee member, Dr. Ronald W. Ward, for generously sharing their time and knowledge with me. I thank Dr. Chris Andrew for his advisement and guidance. I also thank my fellow graduate students in the Food and Resource Economics Department. Above all, I thank my mother, Barbara Briggs; my sister, Maria Cristina Briggs; my uncle, David Browning; and Giancarlo Espinosa for their encouragement and support.
2 Ii TABLE OF CONTENTS page LIST OF LIST OF CHAPTER 1 2 3 PROBIT ORDERED PROBIT Specification of the PROBIT ORDERED PROBIT Model 4 PROBIT PROBIT PROBIT Model 5 ORDERED PROBIT ORDERED PROBIT Parameter ORDERED PROBIT 6 SUMMARY AND iiiAPPENDIX A CONSUMER SURVEY B TIME SERIES PROCESSOR BIOGRAPHICAL iv LIST OF TABLES Table page 3-1 Number of completed interviews, by 3-2 PROBIT model variables and 3-3 ORDERED PROBIT model variables and 4-1 PROBIT model parameter 5-1 Parameter estimates by v LIST OF FIGURES Figure page 1-1 Production of fresh market sweet corn, by 1-2 Sweet corn production areas in 1-3 Food 4-1 Households purchase of sweet corn, by 4-2 Percent buying sweet corn by season, all 4-3 Probability of consuming fresh sweet corn, by city of 4-4 Probability of consuming fresh sweet corn, by educational 4-5 Probability of consuming fresh sweet corn, by income 4-6 Probability of consuming fresh sweet corn, by 4-7 Probability of consuming fresh sweet corn.
3 By 4-8 Probability of consuming fresh sweet corn, by household 4-9 Probability of consuming fresh sweet corn, by presence of 4-10 Probability of consuming fresh sweet corn, by 4-11 Probability of consuming fresh sweet corn, by satisfaction with produce 4-12 Ranking of factors impacting the probability of consuming fresh sweet 5-1 ORDERED PROBIT models base probabilities by 5-2 Probabilities for base and magazines (mgz) in vi5-3 Probabilities for base and good taste, freshness, or tenderness (rsn1) in 5-4 Probabilities for base and habit (rsn3) in 5-5 Satisfaction level for fresh sweet corn purchased in 5-6 Probabilities for base and sat1 in 5-7 Probabilities for base and sat2 in 5-8 Satisfaction level for fresh sweet corn purchased in 5-9 Probabilities for base and television (tv) in 5-10 Probabilities for base and over 55 years of age (age3) in 5-11 Probabilities for base and household size in 5-12 Probabilities for base and presence of children in household (chd) in 5-13 Probabilities for base and over 55 years of age (age3) in 5-14 Probabilities for base and newspapers (nwp) in 5-15 Probabilities for base and white race (rac2) in 5-16 Satisfaction level for fresh sweet corn purchased in vii Abstract of Thesis Presented to the Graduate School of the University of Florida in Partial Fulfillment of the Requirements for the Degree of Master of Science PROBIT AND ORDERED PROBIT ANALYSIS OF THE DEMAND FOR FRESH SWEET CORN By Amanda C.
4 Briggs August 2003 Chair: Robert L. Degner Major Department: Food and Resource Economics The Fresh Supersweet Corn Council (an organization of sweet corn growers and shippers from Florida, Georgia, and Alabama whose members collectively promote their product) is seeking ways to better utilize marketing resources to build consumer DEMAND . In 2001, the Council contracted the Florida Agricultural Market Research Center of the Institute of Food and Agricultural Sciences at the University of Florida to design a consumer survey. The survey sampled approximately 200 households in each of five cities. Trained, professional interviewers conducted telephone interviews of the primary food shopper in the household. Further analyses of the data collected in the survey provide greater insight into factors contributing to the decision to purchase fresh sweet corn or not; and the frequency of purchase in each season.
5 Using cross-sectional household data from this survey, PROBIT estimates reveal important factors influencing consumers decisions to buy fresh sweet corn. viii ixAdditionally, ORDERED PROBIT models are used to predict how a number of factors affect the probability of increasing consumption of fresh sweet corn in each season. These analyses serve to further the understanding of forces driving consumer DEMAND during Fresh Supersweet growers time of production; and help the sweet corn industry design market strategies to increase consumer DEMAND for its product. CHAPTER 1 INTRODUCTION There are three distinct markets for sweet corn in the United States canned, frozen, and fresh. For the most part, these markets operate independently of each other. The fresh market represents two-thirds of the total crop value for sweet corn. According to the Economic Research Service of the Department of Agriculture, 246,900 acres of fresh market sweet corn were harvested in the in 2000 (Lucier and Lin 2001).
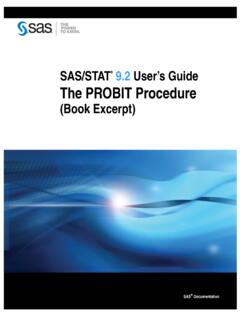
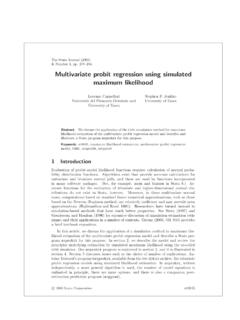
6 Florida leads the nation in the production of fresh sweet corn. Figures from the Florida Agricultural Statistics Service reveal that in 2000, Florida s sweet corn receipts totaled over $121 Million (FASS 2002). Florida accounted for 22% of production of fresh sweet corn during 1998-2000. The value of sweet corn produced in Georgia in 1999 reached almost $53 Million. Georgia s production represented 13% of fresh sweet corn produced from 1998-2000 (Lucier and Lin 2001). 22%17%13%11%37%0%5%10%15%20%25%30%35%40% FloridaCaliforniaGeorgiaNew YorkOthersPercent of Fresh Market Sweet Corn Figure 1-1. Production of fresh market sweet corn, by state Average fresh-market sweet corn production during 1998-2000. Based on data from National Agricultural Statistics Srevice, USDA. 1 2 Members of the Fresh Supersweet Corn Council (FSCC), an organization of sweet corn growers and shippers from Florida, Georgia, and Alabama, are the primary suppliers of fresh sweet corn in the United States from late fall through winter until early July.
7 Fresh Supersweet corn growers are virtually the sole suppliers of fresh sweet corn shipped east of the Mississippi River during the fall, winter, and spring seasons. Most of Florida s sweet corn production (over 30,000 acres) takes place in South Florida (IFAS 1999). Some is produced in Miami-Dade County, but the largest production occurs in the Belle Glade area. These areas supply fresh sweet corn from fall, through spring (until Memorial Day, in late May). Production then moves to areas of northern Florida and into South Georgia and Alabama to supply fresh market sweet corn from late May until early July. Figure 1-2. Sweet corn production areas in Florida Based on data released by Florida Agricultural Statistics Service, June 1999 From: Summary of Florida Corn Production, University of Florida Cooperative Extension Service, Institute of Food and Agricultural Sciences.
8 3 Sixty percent of fresh market sweet corn in the is marketed from May to August with the highest volume in July. Only about 10% of volume is marketed during the winter months (January to March) (Lucier and Lin 2001). Peak shipments take place to meet DEMAND for the Memorial Day and the 4th of July holiday periods. During these holiday times, sweet corn is in high DEMAND and retailers promote the industry s product. However, supersweet corn growers face a challenge in increasing year-round purchases of their product. Although the sweet corn industry has increased consumption of its product through innovations like the introduction of supersweet varieties with a higher sugar content and longer shelf life; and convenient tray-packed corn, several factors still limit potential growth of the industry. According to a 1994-1996 USDA survey, 87% of fresh sweet corn purchases are made at the retail level for home consumption (Lucier and Lin 2001).
9 However, as of 1998, 38% of the consumer s food dollar was spent away from home (ERS 2001). Further, between 1990 and 1998, real spending on food away from home increased whereas real spending on food at home increased just (Clausen 2000). The continuing trend of increased spending on food away from home may have a significant adverse effect on future purchases of fresh sweet corn. Other factors such as product proliferation and convenient ready-to-eat items in supermarket produce sections and the sweet corn industry s inability to gain a substantial share in the foodservice market means sweet corn producers may realize fewer purchase opportunities and a shrinking share of the consumer s food dollar. In addition to those concerns faced by the sweet corn industry as a whole, Fresh Supersweet corn growers face a unique concern: significant seasonality in the DEMAND 4 for fresh sweet corn during the time of year they are marketing their product.
10 Fresh Supersweet corn growers are seeking ways to better use marketing resources to build consumer DEMAND for their product. Understanding the forces influencing consumer DEMAND during their time of production will aid them in designing an effective marketing strategy to expand sales of Fresh Supersweet corn. Figure 1-3. Food expenditures Source: Clauson, Annette. Spotlight on National Food Spending. Food Review, Volume 23, Issue 3. Economic Research Service, USDA. 2000. In an effort to more effectively use its resources to promote fresh sweet corn, the Fresh Supersweet Corn Council needed information from sweet corn retailers and consumers. In response to this need for information, the Florida Agricultural Market Research Center (FAMRC) of the Food and Resource Economics Department at the Institute of Food and Agricultural Sciences of the University of Florida designed comprehensive consumer and retailer surveys.