Transcription of Producer Price Indexes - September 2018
1 Transmission of material in this release is embargoed until USDL 18-0038 8:30 (EST), Thursday, January 11, 2018 Technical information: (202) 691-7705 Media contact: (202) 691-5902 Producer Price Indexes DECEMBER 2017 The Producer Price Index for final demand fell percent in December, seasonally adjusted, the Bureau of Labor Statistics reported today. Final demand prices advanced percent in both November and October. (See table A.) On an unadjusted basis, the final demand index climbed percent in 2017 after a rise in 2016. Most of the December decline in the final demand index is attributable to a decrease in prices for final demand services. The index for final demand goods was unchanged. Prices for final demand less foods, energy, and trade services edged up percent in December after rising percent in November. In 2017, the index for final demand less foods, energy, and trade services climbed percent following a advance in 2016.
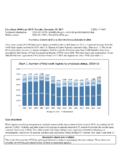
2 Chart 1. One-month percent changes in selected PPI final demand Price Indexes , seasonally adjusted Chart 2. Twelve-month percent changes in selected PPI final demand Price Indexes , not seasonally adjusted '16 JanFebMarAprMayJuneJulyAugSepOctNovDec'1 7 Percent changeFinal demandFinal demand goodsFinal demand '16 JanFebMarAprMayJuneJulyAugSepOctNovDec'1 7 Percent changeFinal demandFinal demand goodsFinal demand services2 Final Demand Final demand services: The index for final demand services moved down percent in December following nine consecutive increases. Most of the decrease can be traced to a decline in margins for final demand trade services. (Trade Indexes measure changes in margins received by wholesalers and retailers.) Prices for final demand transportation and warehousing services fell percent. Conversely, the index for final demand services less trade, transportation, and warehousing inched up percent. Product detail: A major factor in the December decline in prices for final demand services was the index for automotive fuels and lubricants retailing, which fell percent.
3 The Indexes for loan services (partial); airline passenger services; apparel, footwear, and accessories retailing; legal services; and health, beauty, and optical goods retailing also moved lower. In contrast, prices for inpatient care advanced percent. The Indexes for truck transportation of freight and apparel wholesaling also increased. (See table 4.) Final demand goods: Prices for final demand goods were unchanged in December following a increase in November. The index for final demand less foods and energy advanced percent. Conversely, prices for final demand foods declined percent. The index for final demand energy was unchanged. Product detail: In December, prices for basic organic chemicals advanced percent. The Indexes for jet fuel, diesel fuel, home heating oil, and processed young chickens also moved higher. In contrast, prices for beef and veal fell percent. The Indexes for gasoline, fresh and dry vegetables, liquefied petroleum gas, and turbines and turbine generator sets also moved lower.
4 3 Intermediate Demand by commodity Type Within intermediate demand in December, prices for processed goods increased percent, the index for unprocessed goods rose percent, and prices for services edged down percent. (See tables B and C.) Processed goods for intermediate demand: The index for processed goods for intermediate demand climbed percent in December, the fifth straight increase. Seventy percent of the December rise is attributable to a advance in prices for processed materials less foods and energy. The index for processed energy goods also moved higher, increasing percent. Conversely, prices for processed foods and feeds inched down percent. In 2017, the index for processed goods for intermediate demand climbed percent, compared with a advance in 2016. Product detail: In December, a major factor in the rise in the index for processed goods for intermediate demand was prices for plastic resins and materials, which increased percent.
5 The Indexes for basic organic chemicals, diesel fuel, jet fuel, residual fuels, and prepared animal feeds also moved higher. In contrast, beef and veal prices fell percent. The Indexes for gasoline and plastic construction products also declined. (See table 5.) Unprocessed goods for intermediate demand: The index for unprocessed goods for intermediate demand increased percent in December following a rise in November. Nearly three-fourths of the broad-based December advance is attributable to prices for unprocessed energy materials, which climbed percent. The Indexes for unprocessed nonfood materials less energy and for unprocessed foodstuffs and feedstuffs also moved higher, increasing percent and percent, respectively. In 2017, prices for unprocessed goods for intermediate demand rose percent after advancing percent in 2016. Product detail: Over half of the December increase in the index for unprocessed goods for intermediate demand can be traced to natural gas prices, which jumped percent.
6 The Indexes for carbon steel scrap, crude petroleum, raw milk, slaughter barrows and gilts, and slaughter steers and heifers also moved higher. Conversely, corn prices decreased percent. The Indexes for fresh vegetables (except potatoes) and nonferrous scrap also moved lower. 4 Services for intermediate demand: The index for services for intermediate demand edged down percent in December after a jump in November. The decrease can be traced to prices for services less trade, transportation, and warehousing for intermediate demand, which fell percent. The intermediate demand Indexes for both trade services and for transportation and warehousing services were unchanged. In 2017, prices for services for intermediate demand increased percent after rising percent in 2016. Product detail: Leading the December decrease in the index for services for intermediate demand, prices for loan services (partial) dropped percent. The Indexes for legal services, airline passenger services, machinery and equipment parts and supplies wholesaling, and staffing services also moved lower.
7 In contrast, prices for securities brokerage, dealing, investment advice, and related services increased percent. The Indexes for television advertising time sales; metals, minerals, and ores wholesaling; and truck transportation of freight also rose. Intermediate Demand by Production Flow Stage 4 intermediate demand: The index for stage 4 intermediate demand declined percent in December following a jump in November. In December, prices for total services inputs to stage 4 intermediate demand fell percent, and the index for total goods inputs was unchanged. (See table D.) Decreases in the Indexes for loan services (partial), legal services, machinery and equipment parts and supplies wholesaling, gasoline, plastic construction products, and beef and veal outweighed rising prices for diesel fuel; portfolio management; and securities brokerage, dealing, investment advice, and related services. (See table 6.) In 2017, the index for stage 4 intermediate demand increased percent after climbing percent in 2016.
8 5 Stage 3 intermediate demand: Prices for stage 3 intermediate demand moved up percent in December, the fifth consecutive rise. In December, the index for total goods inputs to stage 3 intermediate demand climbed percent, and prices for total services inputs were unchanged. Increases in the Indexes for jet fuel; raw milk; basic organic chemicals; slaughter barrows and gilts; and securities brokerage, dealing, investment advice, and related services outweighed decreases in the Indexes for gasoline, loan services (partial), and machinery and equipment parts and supplies wholesaling. In 2017, prices for stage 3 intermediate demand advanced percent following a rise in 2016. Stage 2 intermediate demand: The index for stage 2 intermediate demand increased percent in December, the sixth straight advance. In December, prices for total goods inputs to stage 2 intermediate demand advanced percent, and the index for total services inputs was unchanged.
9 Higher prices for natural gas; plastic resins and materials; crude petroleum; cable network advertising time sales; securities brokerage, dealing, investment advice, and related services; and basic organic chemicals outweighed declines in the Indexes for legal services, airline passenger services, and liquefied petroleum gas. In 2017, prices for stage 2 intermediate demand increased percent after advancing percent in 2016. Stage 1 intermediate demand: Prices for stage 1 intermediate demand moved up percent in December, the same as in November. In December, the index for total goods inputs to stage 1 intermediate demand advanced percent. Conversely, prices for total services inputs fell percent. Higher prices for basic organic chemicals; carbon steel scrap; diesel fuel; deposit services (partial); natural gas; and securities brokerage, dealing, investment advice, and related services outweighed decreases in the Indexes for loan services (partial), airline passenger services, and gasoline.
10 In 2017, prices for stage 1 intermediate demand climbed percent following a advance in 2016. _____ The Producer Price Index for January 2018 is scheduled to be released on Thursday, February 15, 2018 at 8:30 (EST). 6 ** Recalculated Seasonal Adjustment Factors and Relative Importance Figures to be Available on February 13, 2018 Each year with the release of PPI data for January, seasonal adjustment factors and relative importance figures are recalculated to reflect Price movements from the just-completed calendar year. The following seasonal information will be available on February 13, 2018 (2 workdays prior to the release of PPI data for January 2018 on February 15, 2018): Direct seasonal factors for PPI commodity Indexes for the year 2018, Recalculated seasonal factors for the last 5 years (2013-2017) for PPI commodity Indexes , Recalculated seasonal factors for the last 5 years (2013-2017) for PPI Final Demand-Intermediate Demand Indexes , Recalculated seasonal index data for the last 5 years (2013-2017) for Final Demand-Intermediate Demand and commodity Indexes .
