Transcription of PRODUCT PROPERTY CHART AIR FLOW VS …
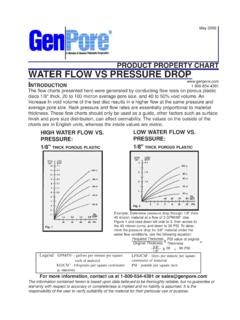
1 AIR FLOW VS PRESSURE DROPPRODUCT PROPERTY CHARTThe information contained herein is based upon data believed to be thoroughly reliable, but no guarentee orwarranty with respect to accuracy or completeness is implied and no liability is assumed. It is theresponsibility of the user to verify suitability of the material for their particular use or more information, contact us at 1-800-654-4391 or 2006 INTRODUCTIONThe flow charts presented here were generated by conducting flow tests on porous plasticdiscs 1/8* thick, 20 to 100 micron average pore size. and 40 to 50% void volume. AnIncrease In void volume of the test disc results in e higher flow at the same pressure andaverage pore size.
2 Back pressure and flow rates are essentially proportional to materialthickness. These flow charts should only be used as a guide, other factors such as surfacefinish and pore size distribution, can affect oermability. The values on the outside of thecharts are In English units, whereas the inside values are AIR FLOW :1/8" THICK POROUS PLASTICLOW WATER FLOW :1/8" THICK POROUS PLASTICE xample: Determine pressure drop through 1/8 thick40 micron material at a flow of 3 GPM/IM2. UseFigure 1 and read down left side to 3, then across tothe 40 micron curve, and down to 30 PSI. To deter-mine the pressure drop for 3/8 material under thesame flow conditions, use the following equation:Required ThicknessOriginal ThicknessPSI value of originalThicknessX=3/8 1/8 X3090 PSI=Legend GPM/IN2 - gallons per minute per square inch of material KG/CM2 - kilograms per square centimeter -micronsLPM/CM2 - liters per minute per squarecentimeter of materialPSI - pounds per square inch