Transcription of Production Possibilities Curve - Mesa Public Schools
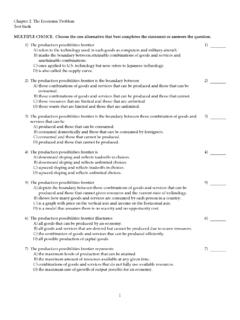
1 Production Possibilities Curve Production Possibilities Trade offs and opportunity costs can be illustrated using a Production Possibilities Curve . PPC shows all the possible combinations of 2 goods or services. Given 2 assumptions: 1. Fixed resources 2. Maximum efficiency. Video Scarcity Opportunity Cost Efficiency Economic Growth Opportunity Cost Opportunity cost of any choice What we forego (give up) when we make that choice All Production carries an opportunity cost To produce more of one thing Must shift resources away from producing something else .. Production Possibilities Graph shows alternative ways that an economy can use its resources. Cost - Production Possibilities graph shows the cost of producing more of one item. Cost Production Possibilities Frontier Production Possibilities Frontier is the line that shows the maximum possible output for that economy. Curve showing all combinations of two goods that can be produced with resources and technology available Society's choices are limited to points on or inside the PPF.
2 Cost Production Possibilities Curve Efficiency - using resources in such a way as to maximize the Production of goods and services economy producing output levels on the Production Possibilities frontier is operating efficiently Growth - if more resources become available, or if technology improves, an economy can increase its level of output and grow. when this happens, the entire Production Possibilities Curve shifts to the right.. Cost Growth Production Possibilities Efficiency Curve Law of Increasing Opportunity Cost: The more of something we produce - the greater the opportunity cost of producing even more of it Cost Law of Growth Increasing Opportunity Cost Production Possibilities Efficiency Curve Future Production Possibilities Real World Technology and the factors of Production do NOT remain constant. Production Curve shifts when technology/new resources become available. The Curve shifts to the right to show new Production Possibilities .
3 Future Production Possibilities Curve Cost Growth Law of Increasing Opportunity Production Cost Possibilities Efficiency Curv


