Transcription of Productivity and Costs First Quarter 2018, Revised
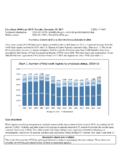
1 Transmission of material in this release is embargoed until USDL 18-0333 8:30 (EST) Wednesday, March 7, 2018 Technical information: (202) 691-5606 Media contact: (202) 691-5902 Productivity AND Costs Fourth Quarter and Annual Averages 2017, Revised Nonfarm business sector labor Productivity growth was Revised to percent in the fourth Quarter of 2017, the Bureau of Labor Statistics reported today, as output increased percent and hours worked increased percent. (All quarterly percent changes in this release are seasonally adjusted annual rates.) From the fourth Quarter of 2016 to the fourth Quarter of 2017, Productivity increased percent, reflecting a increase in output and a increase in hours worked. (See chart 1 and tables A1 and 2.) Annual average Productivity increased percent from 2016 to 2017.
2 (See table C1.) Labor Productivity , or output per hour, is calculated by dividing an index of real output by an index of hours worked by all persons, including employees, proprietors, and unpaid family workers. Unit labor Costs in the nonfarm business sector increased percent in the fourth Quarter of 2017, and increased percent over the last four quarters. (See chart 2 and tables A1 and 2.) Historical Revisions to Productivity and Costs Data Data in this release reflect the annual benchmark revision of BLS Current Employment Statistics program data on nonfarm employment and hours, and the Revised seasonal adjustment of those data. See Revised measures on page 2. Chart 1. Labor Productivity , nonfarm business, 2013Q1 previous Quarter , annual rateFrom same Quarter a year agoPercent changePercent changeChart 2.
3 Unit labor Costs , nonfarm business, 2013Q1 previous Quarter , annual rateFrom same Quarter a year ago-2- BLS calculates unit labor Costs as the ratio of hourly compensation to labor Productivity . Increases in hourly compensation tend to increase unit labor Costs , and increases in output per hour tend to reduce them. Manufacturing sector labor Productivity increased percent in the fourth Quarter of 2017, as output increased percent and hours worked rose percent. These were the largest quarterly increases in manufacturing sector Productivity and output since the second Quarter of 2010, when output per hour increased percent and output jumped percent. Productivity increased percent in the durable goods manufacturing sector and percent in the nondurable goods sector in the fourth Quarter of 2017. Over the last four quarters, total manufacturing sector Productivity increased percent, as output increased percent and hours worked increased percent.
4 Unit labor Costs in manufacturing decreased percent in the fourth Quarter of 2017 and increased percent from the same Quarter a year ago. (See tables A1 and 3.) The concepts, sources, and methods used for the manufacturing output series differ from those used in the business and nonfarm business output series; these output measures are not directly comparable. See the Technical Notes for a more detailed explanation. (See page 6.) Revised measures Quarterly and annual measures of hours and related series including Productivity were Revised historically for all major sectors. The revisions incorporate Revised Current Employment Statistics (CES) program data published February 2, 2018. From 2013 to 2017, the data were subject to revision as a result of annual benchmarking of CES data and Revised seasonal adjustment of those data.
5 From 1990 onward, there were small revisions due to the CES update of the nonfarm payroll series to the 2017 North American Industrial Classification System (NAICS) from the 2012 NAICS basis. Index measures related to hours show full historical revisions because the 2009 base year values were Revised . In addition to revisions to hours data, third Quarter , fourth Quarter , and annual average data for 2017 were Revised to incorporate regular updates of source data on output and compensation. Revised and previous measures for the fourth Quarter of 2017 are shown in table B1 for the business, nonfarm business, and manufacturing sectors. In the fourth Quarter of 2017, nonfarm business Productivity was Revised up slightly from a decline of percent to unchanged ( percent); output and hours worked indexes had small revisions although growth remained at previously reported levels.
6 Unit labor Costs were Revised up from a rate of percent to a rate of percent. Manufacturing Productivity increased percent rather than percent in the fourth Quarter of 2017, as a downward revision to output was smaller than a downward revision to hours. Because an upward revision to hourly compensation was larger than an upward revision to Productivity , manufacturing unit labor Costs were Revised up to a decline of percent a smaller decline than the decrease reported in the preliminary release. (See table B1.) In the third Quarter of 2017, nonfarm business Productivity growth was Revised down slightly to an increase of percent. Unit labor Costs were Revised up from a decline of percent to an increase of percent, reflecting both a point downward revision to Productivity and a point upward revision to hourly compensation.
7 In the manufacturing sector, Productivity declined by percent, a slightly smaller decrease than previously reported. Unit labor Costs were Revised up due to a point upward revision to hourly compensation, and increased percent rather than percent as previously reported. (See table B2.) Nonfinancial corporate sector Productivity increased percent in the third Quarter of 2017, rather than declining percent as -3- previously reported; an upward revision to output was larger than an upward revision to hours. (See table A2.) Annual averages Table C1 presents annual average changes for the most recent 5 years for the nonfarm business sector and the total manufacturing sector. Nonfarm business sector Productivity grew percent in 2017, as output and hours increased percent and percent, respectively. In 2016, Productivity was unchanged ( percent).
8 The average annual rate of nonfarm business sector Productivity growth from 2007 to 2017 corresponding to the current business cycle is percent, which is below the long-term rate from 1947 to 2017 of percent. Unit labor Costs in the nonfarm business sector increased percent in 2017, reflecting increases of percent in hourly compensation and percent in Productivity . Real hourly compensation, which takes into account changes in consumer prices, decreased percent in 2017. Labor share, which is the percentage of output that accrues to workers in the form of compensation, was percent in 2017, which is the lowest annual average in the series going back to 1947. In the manufacturing sector, Productivity increased percent in 2017, as output increased percent and hours worked increased percent. Manufacturing sector Productivity has grown less than percent in each of the last 7 years.
9 The average annual rate of manufacturing Productivity growth from 2007 to 2017 is percent, well below the long-term rate from 1987 to 2017 of percent. Unit labor Costs increased percent in 2017. Quarterly and annual data for all sectors from 2015 to 2017 appear in tables 1-6, and from 2012 to 2014 appear in appendix tables 1-6. Full historical measures can be found at: #data. _____ The preliminary Productivity and Costs news release for First - Quarter 2018 is scheduled to be released on Thursday, May 3, 2018 at 8:30 (EDT). -4- Table A1. Labor Productivity growth and related measures - Revised fourth- Quarter 2017 (percent change from previous Quarter at annual rate and from same Quarter a year ago) Sector Percent change from: Labor Productivity Output Hours worked Hourly compensation Real hourly compensation Unit labor Costs Nonfarm business Previous Quarter A year ago Business Previous Quarter A year ago Manufacturing Previous Quarter A year ago Durable manufacturing Previous Quarter A year ago Nondurable manufacturing Previous Quarter A year ago Table A2.
10 Labor Productivity growth and related measures - Revised and previously published third- Quarter 2017 (percent change from previous Quarter at annual rate) Sector Labor Productivity Output Hours worked Hourly compensation Real hourly compensation Unit labor Costs Nonfinancial corporate Revised Previously published Table B1. Labor Productivity growth and related measures - Revised and previously published fourth- Quarter 2017 (percent change from previous Quarter at annual rate) Sector Labor Productivity Output Hours worked Hourly compensation Real hourly compensation Unit labor Costs Nonfarm business Revised Previously published Business Revised Previously published Manufacturing Revised Previously published Durable manufacturing Revised Previously published Nondurable manufacturing Revised Previously published -5- Table B2.
