Transcription of Project-Management with Gantt-Charts - Apache OpenOffice
1 Project-Management with Calc[Projekt- management und gantt -Diagramm mit Calc and Comment cr er un diagramme de gantt avec ][ ]First editions: [2005-06-06 and 2003-01-03]First English edition: [2005-11-09] and trademark and the the simple bar- chart into a gantt the chart as a graphic in other gantt charting for project the : Planning a the Documentation License, Version with gantt -ChartsiiiCopyright and trademark informationCopyright and trademark informationThe contents of this Documentation are subject to the Public Documentation License, Version (the "License"); you may only use this Documentation if you comply with the terms of this License. A copy of the License is available at: Original Documentation is "Comment cr er un diagramme de gantt avec ".
2 The Initial Writer of the Original Documentation is Serge LE LOUARNE Copyright 2003. All Rights Reserved. (Initial Writer contact(s): DIETMAR HILLER Portions created by DIETMAR HILLER are Copyright 2005. All Rights Reserved.(Contributor contact(s): G. Roderick Singleton. Portions created by G. Roderick Singleton are Copyright 2005. All Rights Reserved.(Contributor .Portions created by _____ are Copyright _____[insert year(s)]. All Rights Reserved. (Contributor contact(s):_____[insert hyperlink/alias]).All trademarks within this guide belong to legitimate owners.[Note: a copy of the PDL is included in this template and is also available at: ]FeedbackPlease direct any comments or suggestions about this document AcknowledgmentsI wish to thank every member of the German and French Native Language Communities who are not mentioned but contributed to my being able to provide a translation.)))
3 To S. Schneider for fixing my errors and with gantt -ChartsiiCopyright and trademark informationModifications and updatesVersionDateDescription of Change[ ][2005-11-09][grs: Initial edition issued for comment][ ][2005-11-12][ss: Proofed edition issued for publication] Project-Management with gantt -ChartsiiiOverviewOverviewGantt Charts are a way to graphically show progress of a project . management of a project is made easier if it is viewed as small manageable items where the dependencies are visually illustrated, parallel processes are discovered, the overall processing time determined and progress tracked. The tasks of a project can be quite complex and dependent on each other. with a project management tool, such as a gantt chart ,all subtasks of a task can be viewed this document a relocation-process to another city is used for all examples and is based upon the accompanying Calc template.
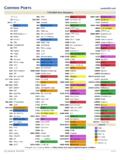
4 Which may be downloaded from illustration 1, the subtasks of the relocation-process appear on the y-axis, and the time line on the x-axis. The bars show when a task should start and when it will be finished. Blue bars show tasks which have been completed. Yellow bars show work which still must be with gantt -Charts5 Illustration 1: The finished exampleRelocation completedMove bank accountOpen an accountReregister carFurnish the flatRegistration officeRelocationForwarding requestSend out new addressOrganise relocationNew leasing contractCancel banking's orderCancel apartment DDHouse-hunting01/04/0501/05/0531/05/050 1/07/0531/07/0531/08/0530/09/05 Relocation DD to MUndoneDoneStartStarting the ProcessStarting the ProcessTo chart a project , all the sub-tasks must first be collected in a spreadsheet.
5 In this simple example there is the name of the task, the start-date and the duration in calendar days:Illustration 2: Task listThis simplified project consists of eight subtasks Task 1 to Task 8 .Next, begin creating the chart by selecting Insert chart :Illustration 3: Create the chartFrom the dialogue AutoFormat chart define the selection range. Neither the first row (containing the column label) nor the first column (containing the task name) should be included as data. Project-Management with gantt -Charts2 Starting the ProcessClick Next >> , and choose the chart type:Illustration 4: Choose chart typeChoose the horizontal bar- chart and click Columns to indicate that the data are arranged in columnar : This changes the assignment of the axis in Calc.
6 Now the horizontal axis is called Y and the vertical axis is called X .Click Next >> and choose the variant Stacked : Project-Management with gantt -Charts3 Illustration 5: Create chart with stacked barsStarting the ProcessClick Next >> once again and enter chart and axis titles:Illustration 6: Adapt chart labelingThe first gantt chart appears as follows:Illustration 7: Bar chartThe task names are on the vertical axis ( Task 1 to Task 8 ) and the time line is on the horizontal axis. Project-Management with gantt -Charts4 Converting the simple bar- chart into a gantt chartConverting the simple bar- chart into a gantt chartIn order to edit the properties of an element in the diagram,. double-click the chart to select it.
7 Next, right-click to open the context menu and gain access to the chart properties:Illustration 8: Edit diagram propertiesNote: Ensure that no element in the diagram is selected, because otherwise the axis-properties can not be editedProject- management with gantt -Charts5 Converting the simple bar- chart into a gantt chartSelect the y-axis, which now is the horizontal time line. (One could also select the horizontal axis using a left-click then right-click to open the context menu and finally choose Object Properties .. to format this axis.)Set the Minimum to the real start-date, In this example this is 01/01/05. Furthermore the axis should get the start date, so check the checkbox Automatic in the line Axis at :This produces a chart as follows: Project-Management with gantt -Charts6 Illustration 9: Adjust the time lineIllustration 10: gantt chartConverting the simple bar- chart into a gantt chartThe orange bar symbolizes the time up to the start of the task.
8 This bar should be made invisible. For this select the orange bar with a left-click, and then open its Object Properties after a right the tab Borders choose Style Invisible, and under the tab Area choose Fill None. Now the chart presents itself as follows: Project-Management with gantt -Charts7 Illustration 11: The completed gantt chartConverting the simple bar- chart into a gantt chartProject- management with gantt -Charts8 Using the chart as a graphic in other applicationsUsing the chart as a graphic in other applicationsTo use the gantt - chart as a picture in another application, save the whole Calc document as HTML. This generates not only the HTML-file, but also a jpeg-file containing the chart which can then be included in other documents, such as impress presentation.
9 Remember to give the graphic a more descriptive name than, the the name suggested when the document is exported to HTML so that it can be found easily laterProject- management with gantt -Charts9 Using the chart as a graphic in other applicationsProject- management with gantt -Charts10 Extending gantt charting for project ManagementExtending gantt charting for project ManagementIn order to manage a project , still more information is needed. The progress of any task should be tracked as a percentage of the task and displayed in the chart , and the dependencies of the subtasks should also be documented. Furthermore the start-date should be determined automatically based on these be able to create such a plan easily, a template was made by the German Native Language Community ( ) called current version of contains the example spreadsheet and the spreadsheet itself can be downloaded from Note: This template uses macros and upon opening displays a security warning.
10 Therefore, macros must be enabled to use the file, created from the template, contains the following columns: Info - Information about the progress of the task No. - unique number of the task. It is recommended to count in intervals of 100, to be able to add tasks later on Activity - description of the task Start - start-date of the task Duration - planned or actual duration of the task in calendar days End - end-date of the task. This gets calculated based on the start-date and duration. Progress in percentage Done - Duration * progress Undone - expected time remaining: Duration - DoneProject- management with gantt -Charts11 Illustration 12: Calc template gantt charting for project management Predecessor - List of tasks, which have to be completed, before this task can start.