Transcription of Protein A280 - Thermo Fisher Scientific
1 Thermo Scientific NanoDrop Spectrophotometers Part of Thermo Fisher ScientificProtein A280 Protein A280 The information in this publication is provided for reference only. All information contained in this publication is believed to be correct and complete. Thermo Fisher Scientific shall not be liable for errors contained herein nor for incidental or consequential damages in connection with the furnishing, performance or use of this material. All product specifications, as well as the information contained in this publication, are subject to change without publication may contain or reference information and products protected by copyrights or patents and does not convey any license under our patent rights, nor the rights of others. We do not assume any liability arising out of any infringements of patents or other rights of third make no warranty of any kind with regard to this material, including but not limited to the implied warranties of merchantability and fitness for a particular purpose.
2 Customers are ultimately responsible for validation of their systems. 2010 Thermo Fisher Scientific Inc. All rights reserved. All trademarks are the property of Thermo Fisher Scientific Inc. and its in and to the technical support image are owned by a third party and licensed for limited use only to Thermo Fisher Scientific by iStockphoto. No part of this publication may be stored in a retrieval system, transmitted, or reproduced in any way, including but not limited to photocopy, photograph, magnetic or other record, without our prior written , Windows, Windows NT and Excel are either trademarks or registered trademarks of Microsoft Corporation in the United States and/or other and Acrobat are trademarks of Adobe Systems, Incorporated. All other trademarks are the property of Thermo Fisher Scientific Inc. and its is a trademark of Thermo Fisher Scientific .
3 Revised 11/2010 Protein A280 Thermo Scientific NanoDrop Spectrophotometers Protein A280 ContentsIntroduction 4 Sample Retention Technology 5 Best Practices 6 Cleaning & Reconditioning 6 Instrument & Cuvette Orientation 7 Sampling Technique 8 Measurements 9 Blank Measurements 9 Sample Measurements 10 Calculations 11 Absorptivity 11 Published Extinction Coefficients 13 Sample Type Options 15 Pathlength & Concentration 17 Calibration 18 Calibration Verification 18 Standard vs Control 19 Troubleshooting 20 Common Reagents 20 Unusual Spectra 21 Reproducibility 22 Instrument Related Issues 23 Installation Errors 24 Connection Errors 25 Signal Errors 25 FAQs 26 Technical Support 29 Thermo Scientific NanoDrop Spectrophotometers Protein A280 This booklet is meant to provide some basic Protein measurement support information for direct A280 methods relevant to Thermo Scientific NanoDrop 2000/2000c, 8000 and 1000 spectrophotometers.
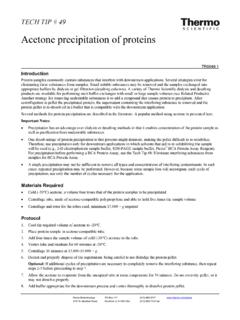
4 Please refer to the model-specific user manual for more detailed instrument and software feature-related information. The patented NanoDrop sample retention system employs surface tension to hold to 2 L samples in place between two optical fibers. Separate booklets for nucleic acid and Protein colorimetric methods are also technical support, please contact: Thermo Fisher Scientific | NanoDrop Products 3411 Silverside Road | Bancroft Building | Wilmington, DE 19810 USAToll-free in US and Canada: Phone: | Fax: | e-mail: Scientific NanoDrop Instrument Serial Numbers: NanoDrop 1000: S/N_ _____, S/N_ _____NanoDrop 2000: S/N_ _____, S/N_ _____NanoDrop 2000c: S/N_ _____, S/N_ _____NanoDrop 8000: S/N_ _____, S/N_ _____Thermo Scientific NanoDrop SpectrophotometersProtein A2805 IntroductionSample Retention TechnologyIntroduction Pipette1 2 Lsampledirectlyontothemeasurementpedesta l. Tip: L aliquots may be used for samples that have 10 mm equivalent absorbance values of or higher (> mg/mL BSA).
5 NanoDrop 2000/2000c model only. Lowerthesamplingarmandinitiateaspectralm easurementusingthesoftwareonthePC. Surfacetensionisusedtoholdsamplesinplace betweentwoopticalfibers. Lightfromaxenonflashlamppassesthroughthe topopticalfiber,downthroughtheliquidcolu mn and is detected by the internal spectrometer. Whenthemeasurementiscomplete,raisethesam plingarmandwipethesamplefromboththe upper and lower pedestals using a dry, lint-free laboratory this technology, NanoDrop spectrophotometers have the capability to measure samples between 50 and 200 times more concentrated than samples measured using a standard 1 cm Protein A280 method is applicable to purified proteins that contain Trp, Tyr residues or Cys-Cys disulphide bonds and exhibit absorbance at 280 nm. This method does not require generation of a standard curve and is ready for Protein sample quantitation at software startup. Colorimetric assays such as BCA, Pierce 660 nm, Bradford, and Lowry require standard curves and are more commonly used for uncharacterized Protein solutions and cell Scientific NanoDrop Spectrophotometers Protein A280 An initial cleaning of both measurement surfaces with dH2O is recommended prior to making the blank measurement.
6 Do NOT use a squirt or spray bottle to apply water or any other liquid to the surface of the instrument. Between measurements: Wipe the sample from both the upper and lower pedestals with a clean, dry, lint-free lab wipe. A final cleaning of both measurement surfaces with dH2O is recommended after the last sample measurement. Do NOT use a squirt or spray bottle to apply water or any other liquid to the surface of the instrument. Additional cleaning: Use 3 L of HCl instead of the dH2O for cleaning when samples have dried on the pedestal. Follow with a 3 L aliquot of dH2O. Detergents and isopropyl alcohol are NOT recommended cleaning agents as they may uncondition the pedestal measurement surfaces. If a solution containing detergents or alcohol is used, follow with 3 5 L of dH2O. Use the NanoDrop Pedestal Reconditioning Compound (PR-1) as a rapid means of reconditioning the pedestals when the hydrophobic surface properties have been compromised and liquid columns break during measurement.
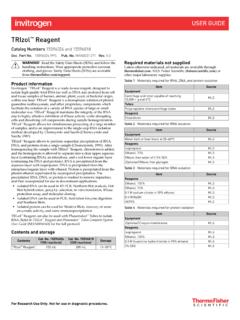
7 1. Open the vial containing PR-1 and use the applicator provided in the kit to remove a pin-head sized amount of the compound. 2. Apply a very thin, even layer of PR-1 to the flat surface of the upper and lower pedestals. Wait 30 seconds for the PR-1 to dry. 3. Fold a clean, dry, lint-free lab wipe into quarters and remove the PR-1 by rubbing the surface of the upper and lower pedestals until no additional dark compound residue shows on the lab PracticesCleaningReconditioning6 Pedestal AssessmentTo check the effectiveness of the reconditioning, pipet a 1 L aliquot of dH2O onto the lower measurement pedestal and visually verify that the water beads up. Droplet flattens out on Droplet beads up on unconditioned pedestal properly conditioned pedestal Thermo Scientific NanoDrop SpectrophotometersProtein A280 Angle the instrument for optimal pipetting. Right-handed orientation for the NanoDrop 2000/2000c and close-up view of the NanoDrop etched arrow as light path guide when inserting quartz or masked plastic Orientation (NanoDrop 2000c only)Below, recommended orientation for left- and right-handed sample dispensing on the NanoDrop PracticesInstrument Orientation7 Best PracticesTip: Locate instrument away from air currents and exhaust Scientific NanoDrop SpectrophotometersProtein A280 Best PracticesSampling Technique8 Volume RequirementUse adequate sample volume to ensure good column formation.
8 Tip: Always use 2 L samples when measuring Protein samples to ensure proper column formation. Surfactants and other components routinely used in Protein buffers may reduce the surface tension properties of the SelectionUse calibrated pipettor with well-fitting (0 2 L)withlow-retention,precision tips to ensure that a sufficient sample (2 L) is delivered for optimal column formation. Tip: To avoid evaporation errors, it is essential to use an eight-channel pipettor to simultaneously load samples when using two or more simultaneously load samples when using two or more simultaneouslypedestal positions on the NanoDrop AliquotsAlwaysuse fresh tips and fresh aliquots for every measurement. Tip: Repeated measurements on the same sample aliquot will result in evaporation, yielding increasing concentrations and/or column HomogeneityHighlyconcentratedproteinsamp lesrequirecarefulattentiontoensurehomoge neity before sampling. Tip: Non-reproducible results observed when making small volume measurements are a good indicator that the sample is not fully in solution or is not homogenous.
9 Tip: It may be necessary to lightly vortex samples prior to sampling to ensure Preparation Sample Preparation Sample PreparationEnsure sample isolation procedure is optimized and sample is purified prior to molecule with absorbance at 280 nm will contribute to the total absorbance used to calculate sample concentrations. Triton X-100 and NP-9 are two examples of components found in common buffers that may contribute to the total absorbance values at 280 Scientific NanoDrop SpectrophotometersProtein A280 Pre-assessment of buffer compatibility with direct A280 measurements: Manybufferscommonlyusedwithproteinsample scontaincomponentswithsignificantabsorba nce in the UV region. Proteins in these types of buffers may not be suitable for direct quantitation using the A280 method. ProteinssuspendedinRIPA buffersmaynotbesuitableformeasurementusi ngtheA280application. It is recommended that a colorimetric assay such as Pierce 660 nm be used for proteins suspended in RIPA buffers.
10 Refer to the reagent manufacturer for more information regarding buffer the steps below to determine if your buffer exhibits significant absorbance in the region of interest: 1. Perform the Cleaning and Reconditioning procedures outlined in the Best Practicessection on page 6. 2. onto the lower measurement pedestal and lower the sampling Click Blank. After the measurement is complete, use a dry, lint-free lab wipe to remove the water from both the top and bottom measurement Pipette an aliquot of the sample buffer onto the pedestal, lower the arm and click Measure. The result should be a spectrum that varies no more than absorbance (10 mm absorbance equivalent) from the baseline at 280 nm. If not, consider using a colorimetric method to quantitate the Protein If the buffer is compatible with the A280 method, load a fresh aliquot of the buffer onto the lower measurement pedestal and lower the sampling arm. Click Blank. 6. After the measurement is complete, use a dry, lint-free lab wipe to remove the buffer from both the top and bottom measurement surfaces.