Transcription of Protein Quality of Cooked Pulses - Pulse Canada
1 Pulses (dry peas, lenti ls, beans and chickpeas) are high Protein foods. The Protein content of Pulses typically ranges from 21% to 26%. For food labeling purposes, Protein content claims are based not only on quanti ty but also on Quality of the Protein in the food product. An in vivo study was conducted to assess the Protein digesti bility of Canadian Pulses to bett er understand the Quality of these plant-based sources of Protein . Foods containing a combinati on of plant Protein sources can have improved Protein Quality due to the complementary amino acid profi les. Reformulati ng cereal-based foods with Pulse ingredients has the potenti al to increase the Protein Quality of the overall food FindingsPULSES AND Protein QUALITYP rotein Quality is determined by its essenti al amino acid compositi on and the digesti bility and bioavailability of its amino acids.
2 Using the Protein Digesti bility Corrected Amino Acid Score (PDCAAS) method, the Protein Quality of Cooked Pulses was measured and compared to casein and commonly consumed cereals. The PDCAAS is a product of the amino acid score and the percent true Protein digesti this current study, navy beans, whole green lenti ls and yellow peas showed the highest PDCAAS values ( to ) while other beans (black, kidney and pinto), chickpeas, split green peas and red lenti ls scored between and While these PDCAAS values are comparable to those in the 1989 WHO/FAO Expert Consultati on on Protein Quality Evaluati on report, new values for split green peas, split red lenti ls, Kabuli chickpeas and navy beans are introduced here (Table 1). As the Protein Quality of foods is dictated by the limiti ng amino acid, the resulti ng PDCAAS values for most Pulses alone may not achieve a Protein content claim under the current regulati ons governing nutriti on labeling of food ( (c)(7)).
3 However, combining Pulses with other plant-based Protein sources such as cereal grains can generate a more complete Protein . Protein Qualityof Cooked PulsesREDUCING THE ENVIRONMENTAL FOOTPRINTFor more information, contact: Pulse Canada : o | 204-925-4455 | and other legumes are plants that are uniquely able to use atmospheric nitrogen as a source of plant nutrients. This greatly reduces the amount of non-renewable energy needed to provide the crop with essenti al nutrients. Growing Pulses releases as litt le as 1/3 of the greenhouse gases of other crops and lowers the carbon footprint of other crops grown in rotati on*. Reformulati ng pasta and other cereal-based products with Pulse ingredients has the potenti al to decrease the carbon footprint of the overall food product.
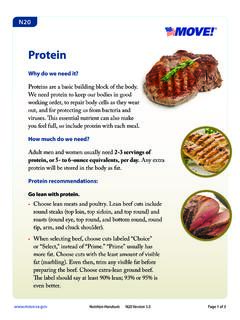
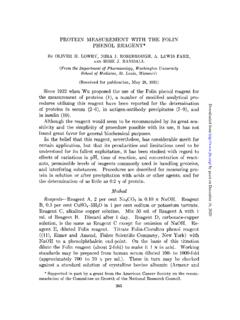
4 *Gan, Y et al, 2011. Field Crops Res. 122: PASTA(100% Durum Wheat Flour)REFORMULATED PASTA(25:75 Lenti l-Durum Wheat Flour) 26% lower carbon footprint 100% increase in fi ber 25% increase in Protein Qualifi es as a Good Source of ProteinComparati ve Analysis ofTraditi onal andReformulated Pasta: Protein Content of Pasta (%)PDCAAS of PastaReference Amount for Pasta (g) Protein per Reference Amount (g)Daily Value for Protein (g)% DRVP rotein Claim Permitt ed SOURCE OF Calculati on based upon the 1989 WHO/FAO Expert Consultati on on Protein Quality Evaluati on and on PDCAAS values for lenti ls from independent studies for Pulse Canada (House et al., 2011, 2014) TABLE 3 Sample calculati ons1 for the Protein Quality of conventi onal wheat-based pasta versus wheat pasta incorporated with 25% lenti l fl our CONVENTIONAL PASTA100% Durum Wheat FlourREFORMULATED PASTA25:75 Lenti l/DurumWheat Flour Blend% DRV = Protein in reference food amount (grams) x PDCAASC ompanies marketi ng foods in the USA can make Protein Quality claims using the PDCAAS values.
5 Protein content claims in the USA are based on a calculati on that accounts for the amount of Protein in a reference amount of a food, the PDCAAS value and the daily value (DV) for Protein which is set at 50 grams. MAKING Protein CONTENT CLAIMS ON FOODSA Good Source of Protein claim can be made when the % DRV for Protein is between to while an Excellent Source of Protein claim can be made when the % DRV for Protein is greater than 20%. Protein claims on multi -ingredient foods can also be calculated using PDCAAS values obtained from a weighted average procedure. For example, the PDCAAS for pasta made with a 25:75 blend of lenti l and durum wheat fl our is shown in Table 3. The weighted PDCAAS for the reformulated pasta has a higher score ( ) than the regular pasta containing 100% durum wheat fl our ( ).
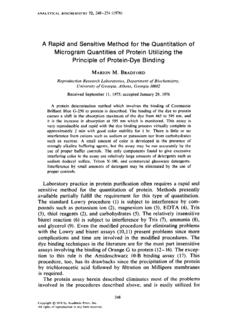
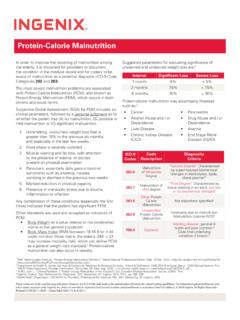
6 Based on both the Protein Quality and quanti ty in the pasta, the additi on of 25% lenti l fl our improves the balance of the essenti al amino acids, thereby qualifying this reformulated product for a Good Source of Protein claim. Reformulati ng foods with Pulse ingredients has the potenti al to increase the Protein content and the Protein Quality of many food products (Figure 1). DRV: Daily Reference ValueDaily Value for Protein (grams) CONTROLNO PEA FLOURPULSE BASED FORMULAWITH PEA (20g)Cookie (30 g)Breakfast cereal (28g)Extruded snack (50g)Chips, corn-based (50g)Bagel (55g)Tortilla (55g)Bread (50g)Pasta/Noodle (85g)45% pea flour( )( )60% pea flour( )( )80% pea flour( )( )32% pea flour( )( )60% pea flour( )( )25% pea flour( )( )25% pea flour( )( )15% pea flour( )( )25% pea flour ( )( )Food Category(Reference Amount, grams) of Protein Per Reference Amount (grams)(PDCAAS VALUE)(PDCAAS VALUE)FIGURE 1 Adding Pulse Flour to Food Products Increases Protein Content and PDCAAS Protein Quality of Cooked PulsesFood products containing a combinati on of plant sources can have improved Protein Quality due to their complementary amino acid profi les.
7 For example, Pulse Protein is higher in lysine and lower in sulphur amino acids than cereals grains such as wheat and rice which are lower in lysine and higher in sulphur amino acids. The eff ect of blending various plant sources to enhance the amino acid profi le is demonstrated by blending Pulses with wheat or rice. The additi on of Pulses to either wheat or rice increases the overall PDCAAS values from and in the individual Pulse or cereal (Table 1) to and in the blends (Table 2). The improved Protein Quality of the combined Pulse and cereal fl ours can have nutriti onal advantages when using these blends for formulati ng food products. Using Pulse ingredients such as pea Protein isolates or concentrates in combinati on with wheat fl ours are another example of improving the PDCAAS scores above that of cereals alone (Table 2).
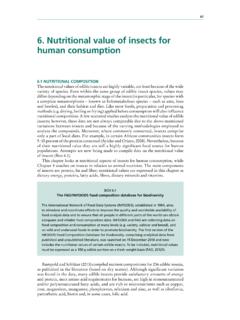
8 COMPLEMENTARY PROTEINSPea (yellow, split)Pea (green, split)Lenti l (green, whole)Lenti l (red, split)Chickpeas (Kabuli)Pinto BeansKidney BeansBlack BeansNavy BeansWheat Flour4 Rice Flour4 Soy Flour (50% Protein )Pea Protein Isolate (82% Protein )Pea Protein Concentrate (50% Protein )Soy Protein Isolate (93% Protein ) Amino acid score is the limiti ng amino acid with the lowest rati o relati ve to the established amino acid requirement values for humans, aged 2 to 5 years AOAC method (n=10)3 PDCAAS = Amino Acid Score x % True Protein Digesti bility4 Data for wheat and rice fl our obtained from the 1989 WHO/FAO Expert Consultati on on Protein Quality Evaluati on. All other PDCAAS values obtained from independent studies for Pulse Canada (House et al, 2011, 2014).5 Sarwar, G. 1997 J.
9 Nutr. 127 1 PDCAAS values for Pulses and select cereal grains AMINO ACID SCORE1 TRUE Protein DIGESTIBILITY2(%) l: Wheat (25:75 Blend)Lenti l: Rice (20:80 Blend)Black Bean: Rice (25:75 Blend)Pea: Wheat (30:70 Blend)Wheat: Pea Protein Isolate (90:10 Blend)Wheat: Pea Protein Concentrate (90:10 Blend)Wheat: Soy Protein Concentrate (90:10 Blend) Amino acid score is the limiti ng amino acid with the lowest rati o relati ve to the established amino acid requirement values for humans, aged 2 to 5 years AOAC method (n=10)3 PDCAAS = Amino Acid Score x % True Protein Digesti bility4 Data for wheat and rice fl our obtained from the 1989 WHO/FAO Expert Consultati on on Protein Quality Evaluati on. All other PDCAAS values obtained from independent studies for Pulse Canada (House et al, 2011, 2014).
10 TABLE 2 PPDCAAS values for cereals blended with Pulse fl ours, Pulse concentrates or Pulse isolates AMINO ACID SCORE1 TRUE Protein DIGESTIBILITY2(%)