Transcription of PROTON NMR SPECTROSCOPY
1 1. H NMR SPECTROSCOPY (#1c). The technique of 1H NMR SPECTROSCOPY is central to organic chemistry and other fields involving analysis of organic chemicals, such as forensics and environmental science. It is based on the same principle as magnetic resonance imaging (MRI). This laboratory exercise reviews the principles of interpreting 1H NMR spectra that you should be learning right now in Chemistry 302. There are four questions you should ask when you are trying to interpret an NMR. spectrum. Each of these will be discussed in detail. The Four Questions to Ask While Interpreting Spectra 1. How many different environments are there?
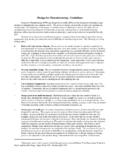
2 The number of peaks or resonances (signals) in the spectrum indicates the number of nonequivalent protons in a molecule. Chemically equivalent protons (magnetically equivalent protons) give the same signal in the NMR whereas nonequivalent protons give different signals. For example, the compounds CH3CH3 and BrCH2CH2Br all have one peak in their 1 H NMR. spectra because all of the protons in each molecule are equivalent. The compound below, 1,2- dibromo-2-methylpropane, has two peaks: one at ppm (the equivalent CH3's) and the other at ppm (the CH2). ppm CH3. ppm Br CH3 Br ppm 10 9 8 7 6 5 4 3 2 1 0. 2. How many 1H are in each environment?
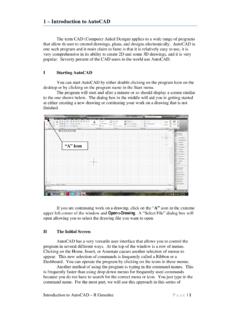
3 The relative intensities of the signals indicate the numbers of protons that are responsible for individual signals. The area under each peak is measured in the form of an integral line. The height of the steps of this line is proportional to the area under the peak and therefore indicates the number of protons. The molecule dimethoxymethane, seen below, has two singlets that have integration areas whose ratio is 2:6. This indicates that there are two equivalent methyl groups (2 x 3 = 6) and one CH2 group(1 x 2 = 2) . A resonance that integrates for three protons indicates a CH3 group. A resonance that integrates for six protons indicates two equivalent CH3 groups, which is generally indicative of an isopropyl group.
4 A resonance that integrates for nine protons indicates three equivalent CH3 groups, which is indicative of a tert-butyl group. 27. O O. H3C CH3 3. Are the 1H's part of a functional group, or are there functional groups nearby? The locations of the peaks (chemical shift, ppm) indicate the types of protons in the molecule. This results from the fact that the magnetic field at the nucleus varies with the electronic (structural) environment for each type of PROTON . The greater the electron density around a PROTON , the weaker the effective field it experiences (shielded) resulting in lower frequency transitions. Shielding can occur in cases where there is extra electron density around a carbon or PROTON , like in a carbanion.
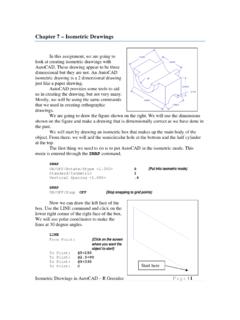
5 Decreases in the electron density will result in an increased effective magnetic field (deshielded) with these protons resonating at a higher frequency. This deshielding effect can be caused by specific functional groups that withdraw electron density from protons, such as the halogens, amines, alcohols, or those containing carbonyls. We can therefore also gain information on which protons are close to these functional groups. In NMR, the frequency scale is typically displayed from highest to lowest. The designations low field, (downfield) and high field (upfield) are historical designations referring to continuous wave (CW) instrument operations, but are used throughout literature and represent the high frequency and low frequency regions, respectively.
6 These designations are shown below: low field high field downfield upfield increasing frequency decreasing frequency deshielded shielded 10 8 6 4 2 0. The position at which a PROTON is located on the bottom axis is its chemical shift ( ). It is commonly expressed in parts per million (ppm) relative to the absorption of the reference signal tetramethylsilane, TMS ( = 0 ppm). The CH3 protons of 1,2-dibromo-2-methylpropane are highly shielded and appear upfield at ppm. The CH2Br protons are deshielded due to the electron withdrawing effect of Br and appear further downfield at ppm. Likewise, the OCH3. 28. protons in dimethoxymethane are shifted downfield due to the electron withdrawing effect of oxygen and appear at ppm.
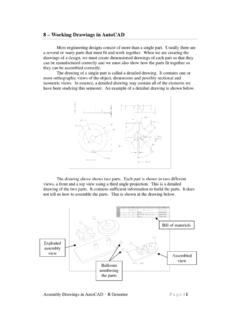
7 4. How many 1H atoms are there on the neighboring carbon atom? We can deduce how many 1H atoms are present on the neighboring carbon atom by examining the number of lines into which a peak has been split. Splitting of a peak is the result of a process called coupling that occurs between 1H's in one environment and those on a neighboring carbon that are in a different environment. In the simplest spectra, such as those we have seen, only singlets are present because there are no nonequivalent 1H atoms neighboring each other. In the example below, 1-chloropropane, three nonequivalent sets of 1H atoms are present, at ppm, ppm, and ppm.
8 They are clearly not singlets. The peak at ppm has three lines, and it is called a triplet. The peak at ppm has six lines; it is a sextet. The peak at ppm is another triplet. The triplet at ppm is actually the CH3. It is a triplet because it is next to a CH2. In general, the number of lines into which a peak is split is given by the formula n + 1, where n is the number of 1H on the neighboring carbons. The next peak, at ppm, is a sextet because it is a CH2 with five total 1H neighbors: a CH3 (3 1H) and a CH2 (2 1H), and five plus one equals six, so we see six lines in the peak. The distance between individual lines in a peak is called the coupling constant (J value).
9 A. larger J value means a larger separation between the lines. The J value for the peak splittings observed in the compounds we have examined so far is typically 7 Hz. The CH3 protons of 1- chloropropane experience a J value of 7 Hz when they couple to the neighboring CH2. Likewise, the neighboring CH2 experiences that same J value of 7 Hz when coupling to the CH3 and the CH2 that is bonded to the Cl. ppm 7 Hz H3C ppm 7 Hz Cl ppm 7 Hz 7 Hz 3 .5 6 5 3 .5 4 3 .5 3 3 .5 2 3 .5 1 0 3 .4 9 3 .4 8 3 .4 7. Splitting of peaks into more than one line is observed between nonequivalent protons (different chemical shifts) separated by three or less bonds.
10 In some systems, 4 and 5 bond couplings are 29. observed occasionally. For example, the underlined protons in H2C=C(Cl)CH3 are not equivalent and therefore split each other. The underlined protons in H2C=C(CH3)2 are equivalent and do not split each other. When a peak is split into several lines, the intensities of the individual peaks follow a predictable pattern, derived from Pascal's Triangle. The intensities of the peaks of a split signal are 1:1 for a doublet, 1:2:1 for a triplet, 1:3:3:1 for a quartet, 1:4:6:4:1 for a quintet, 1:5:10:10:5:1 for a sextet, 1:6:15:20:15:6:1 for a septet, 1:7:21:35:35:21:7:1 for an octet, and 1:8:28:56:70:56:28:7:1 for a nonet.