Transcription of Provisional Number and Rate of Marriages and Divorces ...
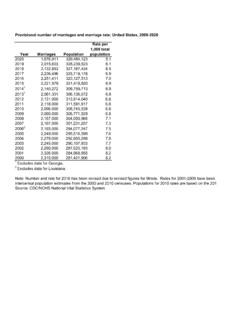
1 Provisional Number of Marriages and marriage rate: United States, 2000-2019 YearMarriagesPopulationRate per 1,000 total population20192,015,603328,239, ,132,853327,167, ,236,496325,719, ,251,411323,127, ,221,579321,418, ,140,272308,759, ,081,301306,136, ,131,000313,914, ,118,000311,591, ,096,000308,745, ,080,000306,771, ,157,000304,093, ,197,000301,231, ,193,000294,077, ,249,000295,516, ,279,000292,805, ,245,000290,107, ,290,000287,625, ,326,000284,968, ,315,000281,421, data for data for : CDC/NCHS National Vital statistics : Number and rate for 2016 has been revised due to revised figures for Illinois. Rates for 2001-2009 have been revised and are based on intercensal population estimates from the 2000 and 2010 censuses.
2 Populations for 2010 rates are based on the 2010 Number of Divorces and annulments and rate: United States, 2000-2019 YearDivorces & annulmentsPopulationRate per 1,000 total population20191746,971272,842, ,038271,791, ,251270,423, ,288257,904, ,909258,518, ,862256,483, ,157254,408, ,000248,041, ,000246,273, ,000244,122, ,000242,610, ,000240,545, ,000238,352, ,000236,094, ,000233,495, ,000236,402, ,000243,902, ,000243,108, ,000236,416, ,000233,550, Excludes data for California, Hawaii, Indiana, Minnesota, and New Excludes data for California, Georgia, Hawaii, Indiana, Minnesota, and New Excludes data for California, Georgia, Hawaii, Indiana, and Excludes data for California, Georgia, Hawaii, Indiana, Louisiana, and Excludes data for California.
3 Georgia, Hawaii, Indiana, and Excludes data for California, Hawaii, Indiana, and Excludes data for California, Indiana, and Excludes data for California, Indiana, Louisiana, and : CDC/NCHS National Vital statistics : Number and rate for 2016 has been revised due to revised figures for Illinois and Texas. Rates for 2001-2009 have been revised and are based on intercensal population estimates from the 2000 and 2010 censuses. Populations for 2010 rates are based on the 2010 census.