Transcription of Public Policy Institute - Caregivers Library
1 Public Policy Institute health AND SAFETY ISSUES IN AN aging WORKFORCE. Introduction Identifying the Older Worker Along with the population as a whole, the "Older in this issue brief will apply to labor force is aging . Even without a concerted workers who are at least 55, even though just effort on the part of policymakers or who merits the label older worker is by no employers to promote longer worklives, the means universally agreed upon. With 55 as number of middle-aged and older persons in the cutoff, the proportion of the labor force the labor force will grow as the 76 million that is older is projected to rise from baby boomers move into and through their percent in 2000 to percent in 2008, 40s, 50s, and 60s.
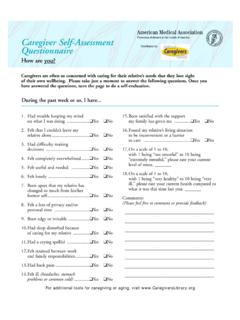
2 Percent in 2015, and percent in 2025. (Figure 1). This issue brief focuses on some of the health and safety issues that might confront Figure 1. businesses employing growing numbers of Proportion of the Labor Force Aged 55. older workers. Does an aging workforce mean and Older, 1950 to 2000 and Projected to more workers at risk of costly illness or 2025. injury? The Bureau of Labor Statistics (BLS). seems to think so, noting that the cost 25%. implications of severe injuries to older 20%. workers [discussed below] are especially 15%. troublesome for the future, given a labor 10%. force growth rate for older workers that is higher than that for the total civilian labor 5%. force. BLS maintains that older workers' 0%.
3 Share of all serious injuries..is likely to 1950 1960 1970 1980 1990 2000 2008 2015 2025. Source: Fullerton 1999a and 1999b; Department of Labor increase..even though their risk of injury is 2001. relatively low ( Department of Labor 1996: 2). How Many Older Workers? Or are concerns such as BLS's overblown? After all, as evident in Figure 1, The number of older persons (55-plus) in the labor force was almost as old in the two the labor force, which stood at about decades following the end of World War II as million in 2000, is projected to rise to it is projected to become. It was only when million in 2008 and to million in 2025. the baby boomers began looking for work that (Fullerton 1999a and 1999b). This would the labor force started getting younger; now represent a 38 percent increase over the next those boomers are helping drive its age up.
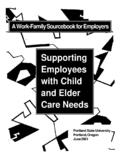
4 Decade and a 75 percent increase over the full Perhaps in light of changes in the physical 25 years. requirements of jobs, a return to an older workforce will have little or no impact on There is reason to suspect that the actual illness and injury rates or work ability. But, if number of older workers will exceed 25 and such concerns are legitimate, there may be 32 million. The projections assume an mitigating measures employers can take. increase of just over 6 percentage points in the labor force participation rate of persons aged 55 and older between 2000 and 2015 and a falling off thereafter (Fullerton 1999a and 1999b). Moreover, virtually all of the IB Number 49. increase between 1999 and 2015 is projected Medical News 2000), with advancing age to occur among persons between the ages of comes an increase in chronic health 55 and 64 (Figure 2).
5 Conditions. For example, the rate of reported arthritis in the 1996 health Interview Study was per 1,000 persons in the population Figure 2. Labor Force Participation Rates of Older aged 18 to 44 but rose to for persons Persons by Sex, 2000 and Projected to between the ages of 45 and 64 and to 2008 and 2015 for the 65-to-74-age group (National Center for health Statistics 1999: Table 57). Nearly 80% 30 percent of adults between the ages of 55. 70%. 2000 2008 and 64, but only 5 percent of those aged 18 to 60%. 50%. 44, report having high blood pressure (Budetti 2015. 40% et al. 2000). Visual and especially hearing 30% impairments also rise sharply with age 20%. (National Center for health Statistics 1999: 10%.)
6 0%. Table 57). Men, 55-64 Women, 55-64 Men, 65+ Women, 65+. Source: Fullerton 1999a and 1999b; Department of Labor 2001 Table 1. Percent Reporting Poor or Fair health Status by Age, 1998. However, the participation rate for the 55. and older population could rise above 18-24 projections if boomers act on their stated 25-44 expectations to work in retirement (see AARP 45-54 1998; Yakoboski and Dickemper 1997), and if 55-64 continuing labor shortages persuade 65-74 employers to offer the work options that older 75+ workers say they want, , phased Source: National Center for health Statistics 2000, retirement, part-time work, and less Table 58. demanding schedules. Even without any marked reversal of retirement trends in the 65- Obesity is another common and limiting plus population , employers can count on many health problem experienced by millions of more older Americans remaining in the labor Americans of all ages.
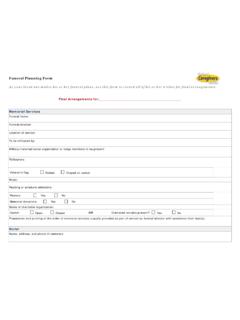
7 To the extent that force in coming decades. The health , safety, obesity, alone or in conjunction with other and cost implications of this development health conditions, affects health and well- remain to be seen. being, the trend is not encouraging. The percentage of adults with healthy weight has Age, health Status, and Activity been declining, and obesity has been Limitations increasing, most notably among older men (Table 2). Obesity also shows a tendency to Most older Americans apparently feel just increase with age up to about 65. In the 55-to- fine, but an appreciable minority do not. As 64-age group, more than 1 in 4 men and 1 in 3. of 1998, nearly 1 in 5 people between the ages women are considered obese.
8 Of 55 and 64 reported that their health was only fair or poor; that was the case for nearly While many chronic conditions are not 1 in 4 between the ages of 65 and 74 (Table necessarily debilitating and can be alleviated 1). with medication, assistive devices, improved diet, and/or exercise, others can significantly Although chronic disability rates in the limit an individual's ability to perform certain 65-plus population have been falling (Reuters Page 2. tasks of daily living (National Academy on an reported that they were unable to carry on aging Society 1999). their major activity (National Center for health Statistics 1999: Table 67). At ages 65. Over one-fifth of people between the ages to 69, the figures were percent for whites of 55 and 64 report some limitation in activity and percent for blacks.)
9 Due to chronic conditions (Table 3), a figure that rises to nearly one-third in the 65-to-74 Low income is also strongly associated population . A small but sizable proportion of with limited activity: the lower the income, the greater the probability of an activity Table 2 limitation. Differences such as these suggest Healthy Weight and Obesity by Sex and that older persons most in need of continued Age, 1960-62 and 1988-94 employment may be the least physically capable of remaining at work. Healthy Weight Obesity Table 3. Percent with Any Activity Limitation 1960- 1988- 1960- 1988- Caused by Chronic Conditions by Age, 1962 1994 1962 1994 1997. Men Age Percent 20-34 35-44 18-24 45-54 25-44 55-64 45-54 65-74 55-64 75+ -- -- 65-74 75+ Women Source: National Center for health Statistics 2000, Table 57.
10 20-34 35-44 Work Limitations and the Older Worker 45-54 55-64 Although the statistics in the previous 65-74 section might raise questions about the work 75+ -- -- ability of many middle-aged and older National Center for health Statistics 2000, Table 68 individuals, the fact that people report less than excellent health or some limitation in middle-aged and older people say they are activity does not mean they are incapable of unable to carry on their major activity. 1 doing any work. Many individuals with chronic health conditions are indeed in the Activity limitation rates are substantially labor force, and many others could likely higher for blacks than whites. For example, as remain gainfully employed, perhaps in a of 1996, percent of whites between the modified work environment or on a reduced ages of 45 and 64, but percent of blacks, work schedule.