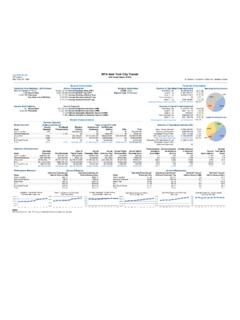
Transcription of Public Transportation’s Role in Responding to Climate Change
1 Public Transportation s Role in Responding to Climate ChangeThe Federal Transit Administration (FTA) collects and analyzes data from across the country on Public trans-portation fuel use, vehicles deployed, rides taken, and other key metrics. These data, taken from the Na-tional Transit Database and combined with information from the Department of Energy and the Environmental Protection Agency, provides valuable insight into the impacts of automobile, truck, SUV, and Public transportation travel on the production of greenhouse gas emissions. National level data show significant greenhouse gas emission savings by use of Public transportation, which offers a low emissions alternative to driving.
2 This paper presents an analysis of the data and frames it in a broader context. It concludes with a description of FTA actions that address Climate on an examination of FTA s data and other academic, government, and industry sources, Public transportation can reduce greenhouse gas emissions by: Providing a low emissions alternative to driving. Facilitating compact land use, reducing the need to travel long distances. Minimizing the carbon footprint of transit operations and Gas Sources: Vehicles and Carbon DioxideCarbon dioxide makes up 95% of all transportation-related greenhouse gas emissions. Cars, SUVs, and pickup trucks running on conventional gasoline, diesel, and other fuels emit carbon dioxide.
3 Combined, these vehicles account for roughly two-thirds of transportation-related emissions, (see fig. 1) ranking transportation as the second largest source of total greenhouse gas Nobel Prize winning 2007 Intergovernmental Panel on Climate Change report concluded that green-house gas emissions must be reduced by 50% to 85% by 2050 in order to limit global warming to four degrees Fahrenheit, thereby avoiding many of the worst impacts of Climate greenhouse gas emissions from transportation will likely require a broad range of strategies, including increasing vehicle efficiency, lowering the carbon content of fuels, and reducing vehicle miles of travel.
4 Public transportation can be one part of the Department of TransportationFederal Transit Administration FIGURE 1 Transportation Accounts For 29% of Greenhouse Gas : Environmental Pro-tection Agency, Inventory of Greenhouse Gas Emis-sions and Sinks: 1990-2007, April , SUVs,AND PICKUPSFREIGHTTRUCKSAIRLINESOTHER6%5%TRA NSPORTATIONELECTRICPOWERINDUSTRYINDUSTRY 33%19% 1%COMMERCIALRESIDENTIALAGRICULTURALU. S. TERRITORIESUPDATED JANUARY 201029%7%57%20%12%10%1 Public Transportation Produces Lower Greenhouse Gas Emissions than AutosNational averages demonstrate that Public trans-portation produces significantly lower greenhouse gas emissions per passenger mile than private ve-hicles (see Figure 2).
5 1 Leading the way is heavy rail transit, such as subways and metros, which produce 76% less in greenhouse gas emissions per passen-ger mile than an average single-occupancy vehicle (SOV). Light rail systems produce 62% less and bus transit produces 33% Estimates are calculated from fuel usage and pas-senger mile data in the 2008 National Transit Data-base, standard emissions factors for different fuels are from the Department of Energy, and sub-re-gional electricity emissions factors are from the Environmental Protection Agency (see Appendix II: Methodology). The environmental benefits of Public transporta-tion vary based on the number of passengers per vehicle, the efficiency of the bus or train, and the type of fuel used (see Appendix I for estimates for transit agencies across the country).
6 The number of riders greatly impacts transit s emissions more passengers that are riding a bus or train, the lower the emissions per passenger mile. For in-stance, bus transit, which has about a quarter (28%) of its seats occupied on average, emits an es-timated 33% lower greenhouse gas emissions per passenger mile than the average single occu-pancy vehicle. The savings increases to 82% for a typical diesel transit bus when it is full with 40 pas-sengers (see Figure 3).What Individuals Can Do to Reduce their Carbon FootprintSwitching to riding Public transportation is one of the most effective actions individuals can take to reduce their carbon footprint.
7 Car transportation alone accounts for 47% of the carbon foot-print of a typical American family with two cars by far the largest source of household emissions and, as such, the larg-est target for potential reductions. (a) The average passenger car in the produces just under 1 pound of carbon dioxide per mile traveled. If just one driver per household switched to taking Public transportation for a daily commute of 10 miles each way, this would save 4,627 pounds of carbon dioxide per household per year equivalent to an reduction in the annual car-bon footprint of a typical American household. This benefit has a greater impact than other actions, such as replacing light bulbs with compact fluorescents (a reduction based on 20 out of 25 light bulbs Change ) or adding R-40 insulation to a home attic (a reduction).
8 (b) Visit FTA s carbon calculator at to estimate how much you can reduce your carbon footprint by switching to Public transportation. (a) Godo Stoyke, The Carbon Buster s Home Energy Handbook, 2007, pp22-23. (b) The Carbon Buster s Home Energy Handbook, 2007, pp22-23 FIGURE 2 Estimated CO2 Emissions per Passenger Mile for Transit and Private Autos Source:See Appendix II for data sources and average passenger car in the United States produces just under one pound of carbon dioxide per mile traveled. iv at eAuto(S OV)BusTr an sitHeav y RailTr an sitLi gh t Rail TransitCommut erRailVan Pool Transit Average Pounds CO2 per Passenger 45bus transitheavy ra illi ght rai lcommut er rai lvan poolAv erage Occupan cyFu ll Sea TRANSPORTATIONSOV triptrip to workgeneral trip4 person carpool2 With these data in mind, when expanding transit service as a greenhouse gas reduction strategy, communities would likely want to ensure that pas-senger loads are sufficient to achieve efficiencies over the alternative of For example.
9 The average 40-passenger diesel bus must carry a mini-mum of 7 passengers on board to be more efficient than the average single-occupancy vehicle. Simi-larly, the average heavy rail car would need to have at least 19% of seats full to exceed the efficiency of an automobile carrying an average passenger load. quent stops in denser urban areas). In terms of ve-hicle efficiency for instance, many transit agencies are replacing older diesel buses with new hybrid-electric buses, which consume 15% to 40% less fuel, and consequently produce 15% to 40% fewer car-bon dioxide emissions. Taking lifecycle emissions into account also shows emissions savings from greenhouse gas emissions per pas-senger mile are significantly lower than those from driving, even taking into account emissions from construction, manufacture, and maintenance.
10 FIGURE 3 Estimated CO2 Emis-sions per Passenger Mile for Average and Full Occupancy Sources: See Appendix II for data sources and methodology. Notes: The average number of passengers for private auto trips is for work trips and for general sources and vehicle efficiency also impact transit s rail transit systems are powered by electricity. Those relying on electricity from a low emissions source, such as hydroelectric, not surprisingly, have much lower emissions than those relying on elec-tricity from coal power plants. (See Appendix I for emissions factors). Rail vehicles also vary in terms of energy efficiency due to weight and engineering from bus systems vary due to the use of low carbon fuels, more energy efficient vehicles, and different operating environments (such as fre-Life cycle emissions include a full accounting of all emissions generated over the full life of a trans-portation system.)