Transcription of Quantification of Ethylglucuronide (ETG), a marker …
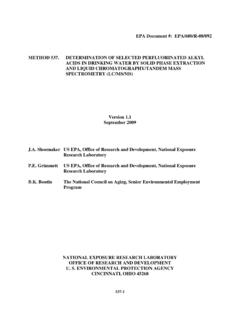
1 P 1 Quantification of Ethylglucuronide (ETG), a marker for chronic excessive alcohol consumption, in hair by Liquid chromatography Tandem mass spectrometry (LC-MS/MS) Dr Stephen Lock1, Dr Simon Elliott2 and Dr Eleanor 1 SCIEX, Warrington, UK and 2 ROAR Forensics, Malvern, UK. Overview A rapid, robust, sensitive and specific LC-MS/MS assay has been developed for the Quantification of Ethylglucuronide (ETG) in hair. Introduction Ethanol (alcohol) is converted to acetaldehyde and subsequently to acetic acid by liver enzymes (Figure 1). The traditional approach to assess the extent of alcohol consumption is through blood and urine analysis but unless the blood or urine samples are stored in appropriate specimen containers, with preservatives such as fluoride oxalate, ethanol can be produced as an artifact of bacterial fermentation post collection1.
2 This can result in elevated and hence inaccurate ethanol concentrations in these samples which can potentially effect the interpretation of any results obtained. (CH3CH2OH, Ethanol)(CH3 CHO, acetaldehyde)alcohol dehydrogenase (CH3CO2H, acetic acid)aldehyde dehydrogenase Enzyme ACSS2 Acetyl-CoA which is broken down toWater and CO2in citric acid - of ethanol consumedglucuronic acid andUDP glucuronyl transferase EtGCH3 OHCH3 OHCH3 OOHF igure1. Metabolism of ethanol in the liver An advantage of the use of ETG in hair is that it is not subject to the effect of bacteria and also offers the opportunity to extend the window of detection (up to 6 months) compared to hours- days in blood and urine2. As ethanol metabolism is independent of dose, blood and urine concentrations can vary widely between individuals, however with hair analysis the use of a 30 pg/mg cut off, as proposed by the Society of Hair Testing (SoHT)3, can be applied as standard.
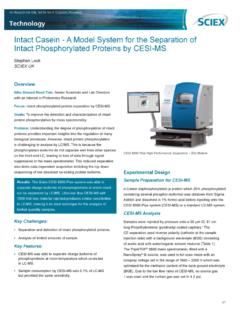
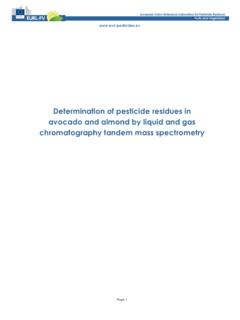
3 Methods to detect ETG in blood and urine have previously been reported4,5 however ethanol concentrations are more commonly measured and accepted internationally as an assessment of alcohol consumption. Below, we present a method to detect ETG in hair using LC-MS/MS analysis which has been developed in accordance with ISO17025 standards. The method uses a solid phase extraction step for sample clean-up similar to previously reported methods6 and has been developed leveraging the sensitivity achievable on the QTRAP 5500 LC-MS/MS system (Figure 2). For the detection of ETG, LC-MS/MS has the advantage over Gas chromatography mass spectrometry (GC-MS) in that it detects the native ETG species which does not have to be derivati zed first [ into a trimethylsilyl (TMS) derivative7] prior to analysis.
4 P 2 Experimental Sample Preparation Hair samples were incubated in water and extracted using an anion exchange SPE cartridge and then reconstituted. During the extraction the samples were spiked with ETG-D5 which acted as the internal standard. LC-MS/MS Methods The final reconstituted extracts were run over a 7 minute gradient using HILIC chromatography on an Agilent HILIC+ M 100 x mm column, at 40 C and the gradient conditions shown in Figure 3 using an Agilent 1290 HPLC System. Mobile phase A was Acetonitrile containing formic acid and B was water containing formic acid and ammonium formate. Step Total Time (mins) Flow rate l/min A % B % 0 0 400 95 5 1 2 400 95 5 2 1100 60 40 3 1100 60 40 4 1500 95 5 5 7 1500 95 5 Figure 3. HPLC gradient conditions for ETG analysis The LC-MS/MS method was performed on a SCIEX QTRAP 5500 System (Figure 2) equipped with Turbo V source and ESI probe set in negative mode at an ionspray voltage of -4500 V.
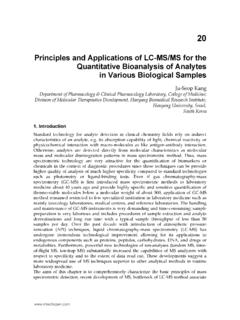
5 The MS conditions used for the experiment are shown in Figure 4. Q1 mass (amu) Q3 mass (amu) CE (V) ETG 85 75 -20 ETG - D 5 226 85 -22226 75 -20 Figure 4. MS/MS conditions used for ETG analysis Results and Discussion Figure 5. Extracted ion chromatograms of hair samples. The top row represents ETG traces and the bottom row the corresponded ETG-D5 internal standard chromatograms. As can be seen in Figure 5, ETG elutes early in the HPLC run so the latter high flow part of the gradient is present to clean and re-equilibrate the HPLC column prior to the next injection. From the signal to noise shown in Figure 5 it can be seen that ETG can be easily detected at low pg/mg concentrations in hair. When a calibration line of spiked hair extracts is analyzed the response is also shown to be linear over the range tested (Figure 6). Figure 6. Calibration line for extracts of hair spiked at different levels 8 - 50 pg/mg.
6 The calibration line shown is generated using the MRM transition 221 ->75 Figure 2. QTRAP 5500 XIC of -MRM (6 pairs): , min01000200030004000 Intensity, = of -MRM (6 pairs): , min01000200030004000 Intensity, of -MRM (6 pairs): , min01000200030004000 Intensity, = of -MRM (6 pairs): , min01000200030004000 Intensity, of -MRM (6 pairs): , min01000200030004000 Intensity, of -MRM (6 pairs): , min01000200030004000 Intensity, pg/mg StandardETG 221 -75 Hair blankETG 221 -75 Real hair sample at 30 pg/mgETG 221 -7530 pg/mg StandardETG-D5 226 -75 Hair blankETG-D5 226 -75 Real hair sample at 30 pg/mgETG-D5 226 -75 XIC of -MRM (6 pairs): , min01000200030004000 Intensity, = of -MRM (6 pairs): , min01000200030004000 Intensity, of -MRM (6 pairs): , min01000200030004000 Intensity, = of -MRM (6 pairs): , min01000200030004000 Intensity, of -MRM (6 pairs).
7 , min01000200030004000 Intensity, of -MRM (6 pairs): , min01000200030004000 Intensity, pg/mg StandardETG 221 -75 Hair blankETG 221 -75 Real hair sample at 30 pg/mgETG 221 -7530 pg/mg StandardETG-D5 226 -75 Hair blankETG-D5 226 -75 Real hair sample at 30 pg/mgETG-D5 226 -75 ETG batch 10 (ETG m/z 75): "Linear" Regression ("No" weighting): y = x + (r = )0102030404550 Analyte Conc. / IS Area / IS Area5352515 ETG batch 10 (ETG m/z 75): "Linear" Regression ("No" weighting): y = x + (r = )0102030404550 Analyte Conc. / IS Area / IS Area5352515In this method several transitions for ETG were detected but it was found that product ions of 75 and 85 seemed to be optimal for the samples run so far. Additional transitions for the internal standard were also acquired but again the 226-75 transition was the strongest with the least amount of matrix interference and was therefore used for Quantification .
8 Summary From the results presented, it can be seen that the use of the very sensitive QTRAP 5500 LC-MS/MS system has allowed for detection of ETG in the pg/mg range and therefore an assessment of alcohol consumption from extracts of hair. The results show that the responses observed are linear over the range tested. Moving forward there are further plans to see if the use of selective techniques like the use of Differential Mobility Separation (DMS) SelexION technology which is available for QTRAP 5500 LC-MS/MS system will remove more of the observed matrix effects. There are also plans to expand this approach to the analysis of drugs of abuse in hair so that long term drug abuse can be monitored. Acknowledgements We would like to acknowledge Dr Simon Elliott, Dr Eleanor I Miller, Julie Evans and ROAR Forensics for their continued contribution to this research area.
9 References , J. J., Poklis, A. and Dalton, H. P. (1993). Journal ofForensic Sciences 38, 1467 , H., Stephanson, N., Beck, O. and Helander, A.(2002). Journal of Analytical Toxicology 26, 201 of Hair Testing Recommendations. " Consensus ofthe Society of Hair Testing on hair testing for chronicexcessive alcohol consumption 2011", , W., Schaefer, P., Thierauf, A., Schreiber, Wurst, F. M. (2004). Journal of the American Societyfor mass spectrometry 15, 188 iseth G , Bernard JP , Karinen R , Johnsen L , HelanderA , Christophersen AS , M rland (2007). J . Forensic SciInt. 172(2-3), Janda, Wolfgang Weinmann, Thorsten Kuehnle,Martina Lahode and Andreas Alt (2002) Forensic ScienceInternational Volume 128, Issues 1-2, 14, Pages Alt, Ines Janda, Stephan Seidl and Friedrich-Martin Wurst (2000). Alcohol and Alcoholism, 35 (3) 313 Research Use Only. Not for use in diagnostic procedures.
10 2012 SCIEX. The trademarks mentioned herein are the property of AB Sciex Pte. Ltd. or their respective owners. AB SCIEX is being used under license. Publication number: 5210112-01