Transcription of Quantitative Risk Calculations for GSX Pipeline
1 Georgia Strait Crossing Pipeline Limited __ March 13, 2003 Page 1 of 14 GSX Pipeline Project Joint Review Panel Hearing Order GH-4-2001 Undertaking for GSX Panel #7 As noted in paragraphs 20006 and 20136 Quantitative Risk Calculations for GSX Pipeline This document presents preliminary estimates of risks to the public that might be created by the proposed operation of the GSX Pipeline . The additional risk Calculations build upon the worst case estimates provided in the NEB application and will be used for emergency response planning. This analysis is preliminary and requires verification and review before using in connection with emergency planning.
2 Normalized Frequency-based Probabilistic Risk Estimates Risk is examined in two parts: probability of a Pipeline failure and consequences of a failure. In order to produce failure probabilities for a specific Pipeline that is not yet operational, a failure frequency estimate based on other Pipeline experience is required. Four sets of Calculations , each based on a different underlying failure frequency, have been performed to produce four risk estimates for the proposed GSX Pipeline . The estimates rely upon frequencies of reportable incidents, fatalities, and injuries as recorded in the referenced databases. The incident rate is used to calculate the probability of failure and the fatality/injury rates are used to estimate consequences. The frequency estimates that underlie each of the four cases are generally described as follows: Case 1 The subject Pipeline is assumed to behave exactly like a hypothetical, statistically average Williams-owned (WGP) gas transmission Pipeline .
3 For this case, WGP system leak experiences are used to predict future performance of the subject Pipeline . Case 2 The subject Pipeline is assumed to behave exactly like a hypothetical, statistically average Canadian gas transmission Pipeline . In this case, the Transportation Safety Board historical leak frequency is used to predict future performance of the subject Pipeline . Case 3 The subject Pipeline is assumed to behave exactly like a hypothetical, statistically average gas transmission Pipeline . In this case, the historical leak frequency is used to predict future performance of the subject Pipeline . Case 4 The subject Pipeline is assumed to behave like some gas transmission pipelines; in particular, those with similar diameter, age, stress level, burial depth, and integrity verification protocols. In this case, the historical leak frequency is used as a starting point to predict future performance of the subject Pipeline .
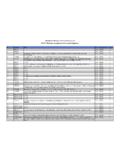
4 Georgia Strait Crossing Pipeline Limited __ March 13, 2003 Page 2 of 14 In all cases, failures are as defined by the respective regulations ( reportable accidents ) using regulatory criteria for reportable incidents. The calculation results for the four cases applied to the proposed miles ( km) of Canadian GSX Pipeline are shown in the following table: Comparison Criteria Failures per Year Injuries per year Fatalities per Year Years to Fail Years to Injury Years to Fatality Annual Probability of an Individual Fatality5 Case 1 WGP 1 0 0 never never 0 Case 2 Canada 2 0 0 never never 0 Case 3 3 2, Case 4 adj4 1, 4, Notes: 1.
5 WGP, All Williams gas transmission systems 1986 2000 2. TSB, Canadian gas transmission pipelines 1994 1998; only one fatality (in 1985 third party excavation) reported for NEB jurisdictional pipelines since 1959; a significant change in definition of reportable incidents occurred in 1989. 3. OPS, US gas transmission pipelines 1986 2002 4. Adjusted by assuming failure rate of subject Pipeline is ~50% of US gas transmission average, by rationale discussed 5. Assumes an individual is threatened by 2,000 ft of pipe (directly over Pipeline , 1000 ft either side, 24-7 exposure). 2,000 ft is chosen as a conservative length based on hazard zone Calculations . 6. This equates to 265 years to fail for the offshore portion only, as reported elsewhere. Case 4 Discussion Case 4 produces the best point estimate for risk for the GSX Pipeline . Note that all estimates suggest that the GSX Pipeline will experience no reportable failures during its design life.
6 Probabilities of injuries and/or fatalities are extremely low in all cases. The DOT database of Pipeline failures provides the best set of pertinent data from which to infer a failure frequency. It is used to support Calculations for Cases 3 and 4 above. Primarily basing failure Calculations on statistics, rather than Canadian, is appropriate because: More complete data available (larger historical failure database and data is better characterized) Strong influence by a major operator on design, operations, and maintenance. Similar regulatory codes, Pipeline environments, and failure experiences. Apparently similar failure experience between the countries. Since the combined experience of all US pipelines cannot realistically represent this Pipeline s future performance (it may encompass this Pipeline , but not represent it), a suitable comparison subset of the data is desired.
7 Variables that tend to influence failure rates and hence are candidates for criteria by which to divide the data, include: time period, location, age, diameter, stress level, wall thickness, product type, depth of cover, etc. Unfortunately, no database can be found that is complete enough to allow such characterization of a subset. Therefore, it is reasonable to supplement the statistical data with adjustment factors to account for the more significant differences between the subject Pipeline and the population of pipelines from which the statistics arise. Rationale supporting the adjustment factors is as follows: Georgia Strait Crossing Pipeline Limited __ March 13, 2003 Page 3 of 14 larger diameter is <10% of failures in the complete database (90+% benefit from higher diameter is implied by the database but only 25% reduction in failures is assumed) lower stress decreases failure rate by 10% (assumption based on the role of stress in many failure mechanisms) new coating decreases failure rate by 5% (assumption note the well-documented problem with PE tape coatings in Canada)
8 New IMP procedures decreases failure rate 10% (assumption based on judgment of ability for IMP to interrupt incident event sequence) deeper cover (2ft of additional depth is estimated to be worth 30% reduction in third party damages according to one European study so a 10% reduction in overall failures is assumed) more challenging offshore environment leads to 10% increase in failures (somewhat arbitrary assumption, conservative since there are no known unresolved offshore design issues) Combining these factors leads to the use of a ~50% reduction from the average gas transmission failure rate. This is conservative accepting a bias on the side of over predicting the failure frequency. Additional conservatism comes from the omission of other factors that logically would suggest lower failure frequencies. Such factors include: initial failure frequency is derived from pipelines that are predominantly pre-1970 construction there are more stringent practices in current pipe and coating manufacture and Pipeline construction better one-call (more often mandated, better publicized, in more common use) better continuing public education designed and mostly operated to Class 3 requirements where Class 3 pipelines have lower failure rates compared to other classes from which baseline failure rates have been derived leaks versus ruptures (leaks less damaging, but counted if reporting criteria is triggered)
9 Company employee fatalities are included in frequency data, even though general public fatalities/injuries are being estimated knowledge that frequency data does not represent the event of one or more fatalities , even though that is the event being estimated Model-Based Failure Consequence Estimates An analysis of consequence, beyond the use of the historical fatality/injury rate described above, has also been undertaken. The severity of consequences (solely from a public safety perspective) associated with a Pipeline s failure depends on the extent of the product release; thermal effects from potential ignition of the released product; and the nature of any damage receptors within the affected area. The area affected is primarily a function of the Pipeline s diameter, pressure, and weather conditions at the time of the event. Secondary considerations include characteristics of the area including topography, terrain, vegetation, and structures.
10 Failure Discussion The potential consequences from a Pipeline release will depend on the failure mode ( leak vs. rupture), discharge configuration ( vertical vs. inclined jet, obstructed vs. unobstructed), and the time to ignite ( immediate vs. delayed). For natural gas pipelines, the possibility of a significant flash fire or vapor cloud explosion resulting from delayed remote ignition is extremely low due to the gas buoyant nature which prevents the formation of a persistent flammable vapor cloud near common ignition sources. Georgia Strait Crossing Pipeline Limited __ March 13, 2003 Page 4 of 14 Thermal radiation from a sustained jet fire, potentially preceded by a fireball, is the primary hazard to people and property in the immediate vicinity of a GSX Pipeline failure.