Transcription of QUARTERLY RESIDENTIAL VACANCIES AND …
1 Data Inquiries Media Inquiries Social, Economic & Housing Statistics Division, Financial & Market Characteristics Branch Public Information Office 301-763-3199 / Robert Callis / Patricia Holley / Daniel Truver 301-763-3030 FOR RELEASE AT 10:00 AM EST, Tuesday, November 2, 2021 QUARTERLY RESIDENTIAL VACANCIES AND HOMEOWNERSHIP, THIRD quarter 2021 Release Number: CB21-166 November 2, 2021 The census bureau announced the following RESIDENTIAL VACANCIES and homeownership statistics for the third quarter 2021: National vacancy rates in the third quarter 2021 were percent for rental housing and percent for homeowner housing.
2 The rental vacancy rate was percentage points lower than the rate in the third quarter 2020 ( percent) and percentage points lower than the rate in the second quarter 2021 ( percent). The homeowner vacancy rate of percent was lower than the rate in the third quarter 2020 ( percent) and virtually the same as the rate in the second quarter 2021 ( percent). (Note: the percent and the percent each round to percent in the tables below). The homeownership rate of percent was percentage points lower than the rate in the third quarter 2020 ( percent) and virtually the same as the rate in the second quarter 2021 ( percent). Table 1. Rental and Homeowner Vacancy Rates for the United States: 2018 to 2021 Rental Vacancy Rate (percent) Homeowner Vacancy Rate (percent) Year First quarter Second quarter Third quarter fourth quarter First quarter Second quarter Third quarter fourth quarter All comparative statements in this report have undergone statistical testing, and unless otherwise noted, all comparisons are statistically significant at the 90 percent significance level.
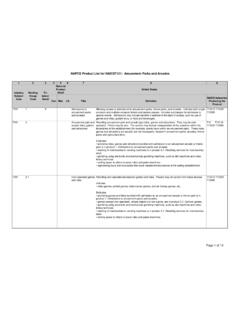
3 For an explanation of how the rates are calculated, please see the Explanatory Notes at the end of the press release. Explanations of confidence intervals and sampling variability can be found on the CPS/HVS website at: < > Source: census bureau , Current Population Survey/Housing Vacancy Survey, November 2, 2021. 0123456789101112199820032008201320182021 PercentQuarterly Rental and Homeowner Vacancy Rates for the United States: 1998-2021 RentalVacancy RateHomeowner Vacancy RateRecessionFigure1 Source: bureau , Current Population Survey/Housing Vacancy Survey, November 2, 2021 Recession data: National bureau of Economic Research, < > RESIDENTIAL VACANCIES AND HOMEOWNERSHIP THIRD quarter 2021 Rental Vacancy Rate Homeowner Vacancy Rate Homeownership Rate Next release: February 2, 2022 Data are not adjusted for seasonality.
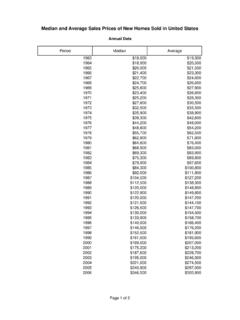
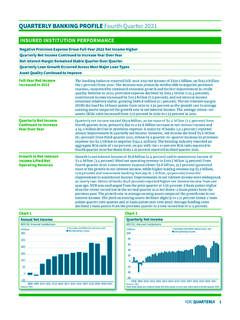
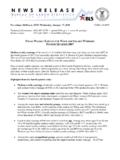
4 Source: census bureau , Current Population Survey/Housing Vacancy Survey, November 2, 2021 Data Inquiries Media Inquiries Social, Economic & Housing Statistics Division, Financial & Market Characteristics Branch Public Information Office 301-763-3199 / Robert Callis / Patricia Holley / Daniel Truver 301-763-3030 In the third quarter 2021, the median asking rent for vacant for rent units was $1,203. In the third quarter 2021, the median asking sales price for vacant for sale units was $285,500. 1. Median asking rent and median asking sales price data for vacant units can be found in Historical Table 11A/B at < > 2.
5 The data in figures 2 and 3 are not adjusted for price changes. 4005006007008009001000110012001300199720 0120052009201320172021 RecessionDollars ($)Median Asking Rent for Vacant for Rent Units: 1997-2021 Figure 250,00075,000100,000125,000150,000175,00 0200,000225,000250,000275,000300,0001997 200120052009201320172021 RecessionDollars($)Source: bureau , Current Population Survey/Housing Vacancy Survey November 2, 2021 Recession data: National bureau of Economic Research, < >, < >Median Asking Sales Price for Vacant for Sale Units: 1997-2021 Figure 3 (Current Dollars) (Current Dollars) Source: census bureau , Current Population Survey/Housing Vacancy Survey, November 2, 2021 Recession data.
6 National bureau of Economic Research, < > Data Inquiries Media Inquiries Social, Economic & Housing Statistics Division, Financial & Market Characteristics Branch Public Information Office 301-763-3199 / Robert Callis / Patricia Holley / Daniel Truver 301-763-3030 The rental vacancy rates in principal cities ( percent) and outside MSAs ( percent) were higher than the rate in the suburbs ( percent). The percent was not statistically different from the percent. The rates in the suburbs and outside MSAs were lower than the third quarter 2020 rate, but the rate in principal cities was not statistically different from the third quarter 2020 rate.
7 The homeowner vacancy rate in principal cities ( percent) was higher than the rate in the suburbs ( percent) but not statistically different from the rate outside MSAs ( percent). The rate outside MSAs was not statistically different from the rate in the suburbs. The rate outside MSAs was lower than the rate in third quarter 2020, and the rates in principal cities and suburbs were not statistically different from the third quarter 2020 rates. The rental vacancy rate was highest in the South ( percent), followed by the Midwest ( percent). The rates were lowest in the Northeast ( percent) and West ( ), and these two regions were not statistically different from each other.
8 The rates in the Northeast and West were lower than their third quarter 2020 rates. The rates in the Midwest and South were not statistically different from the third quarter 2020 rates. The homeowner vacancy rate in the Northeast ( percent) was higher than the rate in the Midwest ( percent). The rates in the Midwest, the South ( percent), and the West ( percent) were not statistically different from each other, and the rate in the Northeast was not statistically different from the South and West. The rates in all regions were not statistically different from the third quarter 2020 rates. Note for Data Users: Comparing Estimates Across Quarters The coronavirus pandemic affected data collection operations for the CPS/HVS during several quarters of 2020 and 2021.
9 In the third quarter of 2021, the pandemic-related restrictions on CPS/HVS data collection had ended in almost all areas, and less than one-half of one percent of cases were affected. However, comparisons of the third quarter estimates to prior quarters may be affected to the extent that restrictions on in-person data collection were more widespread in previous quarters. Data users should therefore understand and consider the changes in data collection operations when interpreting CPS/HVS estimates for the affected quarters and when comparing the affected quarters to other periods See the FAQ for more information. Data Inquiries Media Inquiries Social, Economic & Housing Statistics Division, Financial & Market Characteristics Branch Public Information Office 301-763-3199 / Robert Callis / Patricia Holley / Daniel Truver 301-763-3030 Table 2.
10 Rental and Homeowner Vacancy Rates by Area and Region: Third quarter 2020 and 2021 Rental Vacancy Rates (percent) Homeowner Vacancy Rates (percent) Area/Region Third quarter 2020* Third quarter 2021 Margins of Errora Third quarter 2020* Third quarter 2021 Margins of Errora of 2021 rate of difference of 2021 rate of difference United Inside Metropolitan Statistical ..In principal ..Not in principal ..cities (suburbs) .. Outside Metropolitan Statistical Areas .. aA margin of error is a measure of an estimate s reliability.