Transcription of QUATERLY FACT SHEET FACT SHEET ON FOREIGN DIRECT ...
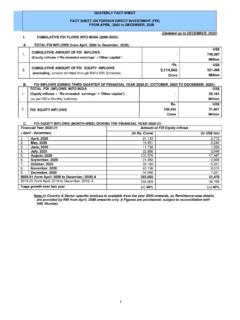
1 QUATERLY FACT SHEET . FACT SHEET ON FOREIGN DIRECT INVESTMENT (FDI). FROM APRIL, 2000 to MARCH, 2021. (Updated up to MARCH, 2021). I. CUMULATIVE FDI FLOWS INTO INDIA (2000-2021): A. TOTAL FDI INFLOWS (from April, 2000 to March, 2021): US$. CUMULATIVE AMOUNT OF FDI INFLOWS. 1. - 763,576. (Equity inflows + Re-invested earnings' + Other capital'). Million Rs. US$. CUMULATIVE AMOUNT OF FDI EQUITY INFLOWS. 2. 3,174,480 529,633. (excluding, amount remitted through RBI's NRI Schemes). Crore Million B. FDI INFLOWS DURING FOURTH QUARTER OF FINANCIAL YEAR 2020-21 (JANUARY, 2021 TO MARCH, 2021): TOTAL FDI INFLOWS INTO INDIA US$. 1. (Equity inflows + Re-invested earnings' + Other capital') - 13,438.
2 (as per RBI's Monthly bulletins) Million Rs. US$. 2. FDI EQUITY INFLOWS 59,514 8,165. Crore Million C. FDI EQUITY INFLOWS (MONTH-WISE) DURING THE FINANCIAL YEAR 2020-21: Financial Year 2020-21 Amount of FDI Equity inflows ( April - December) (In Rs. Crore) (In US$ mn). 1. April, 2020 21,133 2,772. 2. May, 2020 16,951 2,240. 3. June, 2020 11,736 1,550. 4. July, 2020 22,866 3,049. 5. August, 2020 130,576 17,487. 6. September, 2020 21,350 2,906. 7. October, 2020 39,160 5,331. 8. November, 2020 63,196 8,515. 9. December, 2020 56,086 7,621. 10. January, 2021 19,790 2,707. 11. February, 2021 18,822 2,587. 12. March, 2021 20,903 2,872.
3 2020-21 (form April, 2020 to March, 2021) # 442,569 59,636. 2019-20 (form April, 2019 to March, 2020) # 353,558 49,977. %age growth over last year (+) 25% (+)19%. Note:(i) Country & Sector specific analysis is available from the year 2000 onwards, as Remittance-wise details are provided by RBI from April, 2000 onwards only. # Figures are provisional, subject to reconciliation with RBI, Mumbai. 1. D. SHARE OF TOP INVESTING COUNTRIES FDI EQUITY INFLOWS (Financial years): Amount in Rupees Crores (in US$ Million). %age to Cumulative Rank 2018-19 2019-20 2020-21 total Inflows s Country (April (April (April Inflows (April, 00 - March) March) March) (in terms March,21).)
4 Of US $). 1. MAURITIUS 57,139 57,785 41,661 837,602. 28%. (8,084) (8,241) (5,639) (148,350). 112,362 103,615 129,227 738,789. 2. SINGAPORE 22%. (16,228) (14,671) (17,419) (115,089). 22,335 29,850 102,499 278,721. 3. 8%. (3,139) (4,223) (13,823) (43,602). 27,036 46,071 20,830 229,152. 4. NETHERLANDS 7%. (3,870) (6,500) (2,789) (36,641). 20,556 22,774 14,441 210,546. 5. JAPAN 7%. (2,965) (3,226) (1,950) (35,449). 9,352 10,041 15,225 165,637. 6. 6%. (1,351) (1,422) (2,043) (30,254). 6,187 3,467 4,910 73,854. 7. GERMANY (886) (488) (667) (12,863) 2%. 6,356 2,393 31,242 72,944. 8. UAE (898) (339) (4,203) (11,193) 2%. 2,134 6,449 2,839 60,833.
5 9. CYPRUS 2%. (296) (879) (386) (11,134). 7,147 26,397 20,779 70,627. 10. CAYMAN ISLANDS 2%. (1,008) (3,702) (2,799) (10,335). TOTAL FDI EQUITY INFLOWS FROM ALL 309,867 353,558 442,569 3,175,013. COUNTRIES * - (44,366) (49,977) (59,636) (529,755). *Includes inflows under NRI Schemes of RBI. Note: (i) Cumulative country-wise FDI equity inflows (from April, 2000 to March, 2021) are at Annex- A'. (ii) %age worked out in US$ terms & FDI inflows received through FIPB/SIA+ RBI's Automatic Route + acquisition of existing shares only. (iii) Figures are provisional. E. SECTORS ATTRACTING HIGHEST FDI EQUITY INFLOWS: Amount in Rs. Crores (in US$ Million).
6 Cumulative % age to total 2018-19 2019-20 2020-21. Inflows Ranks Sector (April (April (April Inflows (In (April, 00 - terms of US$). March) March) March). March, 21). 1. SERVICES SECTOR ** 63,909 55,429 37,542 509,272. 16%. (9,158) (7,854) (5,060) (87,063). COMPUTER SOFTWARE & 45,297 54,250 194,291 470,298. 2. 13%. HARDWARE (6,415) (7,673) (26,145) (71,056). 3 TELECOMMUNICATIONS 18,337 30,940 2,884 222,073. 7%. (2,668) (4,445) (392) (37,663). 4. TRADING 30,963 32,406 19,349 195,353. 6%. (4,462) (4,574) (2,608) (30,203). CONSTRUCTION DEVELOPMENT: Townships, housing, built-up 1,503 4,350 3,117 127,081. 5. 5%. infrastructure and construction- (213) (617) (422) (26,084).
7 Development projects 6. AUTOMOBILE INDUSTRY 18,309 19,753 12,115 155,857. 5%. (2,623) (2,824) (1,637) (25,848). CONSTRUCTION 15,927 14,510 58,240 166,622. 7. 5%. (INFRASTRUCTURE) ACTIVITIES (2,258) (2,042) (7,875) (24,721). CHEMICALS (OTHER THAN 13,685 7,492 6,300 104,855. 8. 3%. FERTILIZERS) (1,981) (1,058) (847) (18,487). 9. DRUGS & PHARMACEUTICALS 1,842 3,650 11,015 98,830. 3%. (266) (518) (1,490) (17,991). 10. 7,590 21,060 2,761 94,540. HOTEL & TOURISM 3%. (1,076) (2,938) (369) (15,658). Note: (i)** Services sector includes Financial, Banking, Insurance, Non-Financial / Business, Outsourcing, R&D, Courier, Tech. Testing and Analysis, Other (ii) Cumulative Sector- wise FDI equity inflows (from April, 2000 to March, 2021) are at - Annex- B'.
8 (iii) FDI Sectoral data has been revalidated / reconciled in line with the RBI, which reflects minor changes in the FDI figures (increase/decrease) as compared to the earlier published sectoral data. (iv) Figures are provisional. 2. F. STATES/UTs ATTRACTING HIGHEST FDI EQUITY INFLOWS. Amount in Rupees Crores (in US$ Million). Cumulative %age to total S. 2019-20 2020-21. STATE Inflows Inflows No. (October (April . (October, 19 - (in terms March) March). March, 21) of US$). 18,964 1,62,830 1,81,794. 1 GUJARAT 30%. (2,591) (21,890) (24,481). 52,073 1,19,734 1,71,807. 2 MAHARASHTRA 28%. (7,263) (16,170) (23,432). 30,746 56,884 87,631.
9 3 KARNATAKA 14%. (4,289) (7,670) (11,959). 28,487 40,464 68,951. 4 DELHI 11%. (3,973) (5,471) (9,444). 7,230 17,208 24,439. 5 TAMIL NADU 4%. (1,006) (2,323) (3,329). 13,208 5,993 19,200. 6 JHARKHAND 3%. (1,852) (792) (2,644). 5,198 12,559 17,757. 7 HARYANA 3%. (726) (1,697) (2,423). 4,865 8,618 13,483. 8 TELANGANA 2%. (680) (1,155) (1,835). 698 4,719 5,417. 9 PUNJAB 1%. (97) (644) (741). 1,738 3,123 4,861. 10 UTTAR PRADESH 1%. (243) (422) (665). Note: (i) Cumulative State-wise/UT-wise FDI equity inflows (from October, 2019 to March, 2021) are at Annex- C'. (ii) %age worked out in US$ terms & FDI inflows received through FIPB/SIA+ RBI's Automatic Route + acquisition of existing shares only.
10 (iii) Figures are provisional. 3. II. FINANCIAL YEAR-WISE FDI INFLOWS DATA: A. AS PER INTERNATIONAL BEST PRACTICES: (Data on FDI have been revised since 2000-01 with expended coverage to approach International Best Practices). (Amount US$ Million). FOREIGN DIRECT INVESTMENT (FDI). Equity FDI FLOWS INTO. INDIA Investment by FII's FOREIGN Institutional S. Financial Year FIPB Equity Re- Other Investors N (April-March) Route/ capital invested %age capital Fund o. RBI's of earnings growth (net). Automati unincor +. + Total over c Route/ porated FDI previous Acquisiti bodies Flows year on Route # (in US$. terms). FINANCIAL YEARS 2000-01 TO 2020-21.