Transcription of Questions Macroeconomics (with answers)
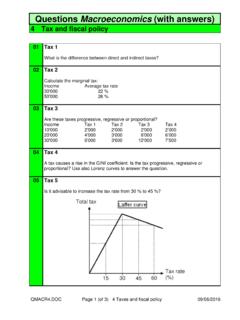
1 Questions Macroeconomics ( with answers ). 6 Aggregate Demand (Keynesian Model). This exercise is based on the following source: Stephen Dobson and Susan Palfreman: Introduction to Economics, Oxford University Press, Oxford / New York 1999, ISBN 978-0-19-877565-2, pp. 207 to 234. 1 Consumption, investment and saving (neither government nor foreign trade). A consumption function ( Questions - ). Aggregate demand (consumption = C). C. 40. 10. 0. 50. Graph 1 Output, income (Y). Questions - Q General form of the consumption function: C = a + bY. Calculate the numbers of a and b according to graph 1? Q Explain the difference between autonomous and induced consumption. Q Explain the marginal propensity to consume (MPC). Page 1 (of 6) 6 Aggregate Demand 14/06/2016.
2 Q What happens to the consumption-line C in graph 1 if a rises;. b rises? Q Compare the consumption functions in two different coutries by using a graph: Country A: C = Country B: C = Q Y is the sum of C + S (= saving). If C = a + bY, then S = -a + (1-b)Y. Draw the saving function in a graph (using for a and b the numbers according to Q ): Saving 0. Y. Q How much is the marginal propensity to save (MPS) (Q )? Q Explain why the sum of MPC and MPS equals to 1. Q Investment (I) is dependent on the interest rate and on the expectations of future profits, but not on income. Illustrate this in a graph: Investment Y. Q How does graph 1 look like if aggregate demand = C + I. Assume that I = 10. Page 2 (of 6) 6 Aggregate Demand 14/06/2016.
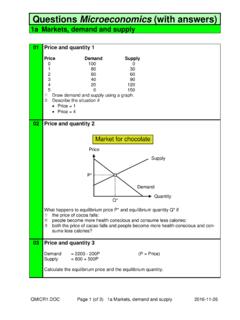
3 Determination of Y and the multiplier ( Questions - ). Aggregate demand AD. (C + I). o 45. I II III. Graph 2 Output, income (Y). Questions - Q Explain the 45o-line in graph 2 (x- and y-axis have the same scale.). Q Where is the equilibrium in graph 2? Q Ist the equlibrium-Y also the full-employment-Y? Q In graph 2, I rises. Illustrate the new equilibrium and the multiplier. Q Choose in graph 2 a point of disequilibrium and explain the tendency to equilibrium. Q During a recession, a country wants to get a higher Y (+ 600). By how much must rise investing if the multiplier is Q 1. Multiplier* = 1 - MPC (MPC = Marginal propensity to consume). Calculate the multiplier if the consumption function is as follows: C = 5 + * (The multiplier is the result of such a geometric progression: 1 + b + b2 + b3 +.)
4 + bn). Page 3 (of 6) 6 Aggregate Demand 14/06/2016. Q Calculate the multiplier if the marginal propensity to save (MPS) is Q Two different consumption functions: Consumption function I: C = 10 + Consumption function II: C = 10 + In which case is the multiplier larger? Q In equilibrium, injections (investing) equal withdrawals (saving). Illustrate this in a graph as follows: Saving, Investing 0. Y. Assumptions: S = -a + (1-b)Y. I depends on interest rates and on expectations, not on Y. 2 Aggregate demand with government (but without trade). Questions - Q Government spending (G) is part of AD and is dependent on political decisions, not on Y. How must be changed graph 2 (page 3) if we add G? Q Taxes (T) depend on income; they reduce income and consumption: T = tY (t = Marginal prospensity to tax, MPT).
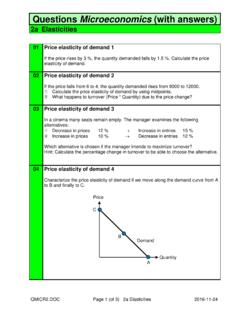
5 The consumption function depending on disposable income: C = a + b(Y-T). Calculate the multiplier by substituting tY for T. Page 4 (of 6) 6 Aggregate Demand 14/06/2016. Q This graph shows AD (C + I + G) before taxes. How must be changed the graph if we take into account taxes? AD AD (before taxes). Y. 3 Aggregate demand with government and foreign trade Questions - Q Exports (X) are part of AD and depend on incomes abroad, not on domestic Y. Imports (M) reduce AD and depend on Y: M = mY (m = Marginal propensity to import, MPI). Draw three graphs as follows: Exports Imports Exports - Imports Y Y Y. Page 5 (of 6) 6 Aggregate Demand 14/06/2016. Q AD = C + I + G + (X - M). C = a + b(Y - T). T = tY. M = mY. Substitute tY for T and mY for M and calculate the overall multiplier.
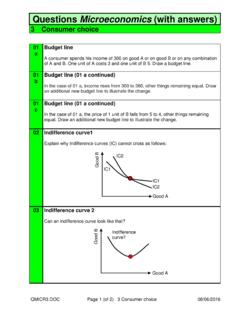
6 Q How must be changed this graph if we take into account foreign trade? AD AD (without foreign trade). C+I+G. Y. Q The injections I, G and X do not depend on income, whereas the withdrawals S, T and M are dependent on income. Equilibrium exists if I + G + X = S + T + M . Illustrate the equilibrium in an open economy in a graph: Injections, withdrawals 0. Y. Q Rearranging the formula in Q , we get: (I - S) + (G - T) + (X - M) = 0. What can be concluded if I > S and, simultaneously, G > T? answers . Click here! Page 6 (of 6) 6 Aggregate Demand 14/06/2016.