Transcription of Quick Start Guide - Amazon Web Services
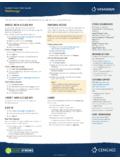
1 SYSTEM REQUIREMENTSW indows Windows 2000 Service Pack 4 or later, XP, or Vista 500 MHz Pentium class processor or better Sun Java Runtime Environment (JRE) Version 6 Update 2 or later 256MB RAM 1024 x 768 Minimum Screen ResolutionTHE WIZARDM acintosh Macintosh computer with a PowerPC G3, G4 or G5 processor 256MB of RAM Java for Mac OSX 1024 x 768 Minimum Screen ResolutionA wizard will gather basic information about your client. As the questionnaire is filled out, names of participants will be added to the People panel, located on the right side of the screen. This panel allows you to easily choose one or multiple owners of accounts that you will enter later in the plan.
2 The participants of a plan and other information entered in the wizard can be changed at any time by selecting the People tab on the left navigation panel. Quick Start Guide ORAfter opening Voyant you will be presented with two options: to create a new client record or to access an existing Records can be accessed at any time by clicking the icon located in the top left corner of the the Client from the menu and then click Open in the bottom right corner of the dialogue box. Create a New Record by clicking the New Client button in the bottom left corner of the dialogue STARTEDNAVIGATIONNew ClientOpen ClientManage PlansHelpPreferencesSave ClientThe timeline is used to illustrate life as a series of stages and events to allow for effortless revision.
3 The timeline begins on the Start date of the plan and ends on an automatically set mortality event. THE TIMELINEE ventsStagesAdd Events as You PlanEvents are specific future planning points that can be treated as single occurrences or can be linked to other events (ex. New Home, Wedding, Pensions).Stages are time periods that help define financial planning needs. Stages are dependent upon Start and end events (ex. Children at Home, Education, Retirement).New events can also be added to the timeline from the data entry screens (ex. Expenses, Estate Plans, Savings, Debt, Taxes) to prevent interruption of your ongoing create an event Select an owner of the event in the left side of the Events Panel Find an icon to represent the new event Drag & Drop the event onto the timeline above desired age To rename the new event, double click on the existing name, type in the new name, and press Enter To move existing events, simply drag and drop them to the desired locationTo create a stage In Stages Panel, find a color swatch for your new stage (Note.)
4 Stage names in Stages Panel are only suggestions and can be changed after being added to the timeline) Drag and Drop the selected icon onto the timeline. To rename the new stage, double click on the name in the Bar that appears at the top of the timeline, type the new name, and press Enter Drag the green circle on the left of the Stage Bar to the event that will mark the beginning of the stage, and drag the red circle on the right to the event that will mark the end of the stage To add an event along the way Go to the Time panel to the right of the screen, located next to the ledger and the People panel Select the Time panel s Event tab, and click the New Event button (bottom right).
5 Events can be positioned on the timeline based on future year or owner age Click Add. The new event will now appear on the Time panelQuick Start Guide Quick Start Guide People PanelChoose one or multiple owners of account itemLedgerTracks planning information. When an item is selected in the ledger, the item becomes active and can be editedTime PanelChoose a timespan for active account item. A green bullet indicates the Start event and a red bullet indicates the end eventSpecifics regarding income, savings, windfalls, investments, pensions, property, debts, insurance, taxes and expenses are added through a series of data entry screens. These entries will be used ultimately to formulate the financial plan, which will be illustrated in the Let s See charts and summarized in Voyant s Overviews and INFORMATIONLet s See charts not only illustrate the long-term results of a plan, they can also be used to compare results between plans and to run simulations and horizontally over the bars of the Incomes chart is the need line.
6 This gray line indicates the amount of income needed to meet the expenses projected for each year in the plan. Beneath this line sections of bars are coloured red to show projected shortfalls, whereas bars that rise above the need line point to surplus S SEEC hart LegendClick Detailed Info to view the year s transactional detailsEvent IndicatorHover for detailsTotal Need LineBasic Need LineExpand Suggestions Panelclickable set of categories to choose from when making detailed entriesShow Advanced Settingssuch as growth rates, account contributions, the step up / step down feature, and asset allocationsAdd entries & selectionsClear entries & selectionsNext ScreenLet s See the interactive chartsQuick Start Guide Need Analyzers can be used to find Quick answers to projected cash flow problems.
7 How much would be needed as a lump sum windfall to prevent future shortfalls? What baseline rate of return is required from investments? Which investments will provide adequate reserves for future living expenses?Let s See charts show the projected results from a plan. Charts are available to view future income, assets, debts, expenses and net worth. The drop-down chart selection menu offers Quick navigation from chart to Let s See charts are controlled in the panel at the bottom of the screen. Charting tools including dual charts, plan comparisons, and simulations are also accessed from this panel. The Life Insurance Need analysis illustrates the impact an untimely death may have on the financial outlook of a plan and then utilizes this simulation to analyze the appropriate level of assurance to alleviate the loss of current and potential future Long Term Care simulation is designed to show users the impact of long term medical care expenses on a client s Monte Carlo simulation analyzes the risk of a financial plan and calculates the plan s probability of success using market Capacity tests resiliency of client cases by simulating a market loss (and the possibility of a rebound) over a one to five year period.
8 Potential IHT calculates a year-by-year inheritance tax position, which will be a joint mortality estimate for couples. These results can be compared between planning Income Protection simulation illustrates the possible loss of earnings and disruption of future opportunities caused by a simulations apply historical growth rates from the FTSE All Share Index to see how the current investments might perform in a variety of market Performance slider is a simulation tool used to illustrate whether planning goals will be met as the performance is adjusted upwards or Real Money simulation shows future values (cash flow, assets, expenses, net worth) in today s terms, without inflation.
9 Growth is weighed against the Retail Price Index. CHART SELECTIONSIMULATIONSCHART CONTROLSD efaultChart ViewSide-by-sidecomparisonmodeAccessSimu lationsPanelAccessLoss CapacitySimulationsPanelCompare Plans allows comparison of like charts from two What-If PlansEdit Time allows timeline events to be adjusted and the results to be viewed immediately in the chartsA What-If Plan is a copy of the current plan which can be used to explore the various simulations and optionsOne-Click SimulationsClient records can be built out to contain multiple plans. As Voyant is used to explore different strategies, options and their implications, these iterations can be saved as plans within a client record.
10 Client records will always contain a minimum of one plan, beginning with a base add a new plan to a client record, click the What If button located in the top left corner of the screen or on the control panel of the Let s See screen. The plan created will be a copy of the plan that is currently charts, overviews and account specific transactions from a plan can be output into reports with the click of a button. Reports are selected and generated from the Reports screen, found on the left navigation panel. Reports are modular. Sections are selected for inclusion in the output document by using either the transfer arrows or by dragging and dropping the desired sections from the left window to the right.