Transcription of RACIAL AND ETHNIC DISPARITY IN STATE PRISONS
1 THE COLOR OF JUSTICE: RACIAL AND ETHNIC DISPARIT Y IN STATE PRISONSThis report was written by Ashley Nellis, , Senior Research Analyst at The Sentencing Sentencing Project is a national non-profit organization engaged in research and advocacy on criminal justice issues. Our work is supported by many individual donors and contributions from the following:Atlantic PhilanthropiesMorton K. and Jane Blaustein Foundation craigslist Charitable FundFord Foundation Bernard F. and Alva B. Gimbel Foundation Fidelity Charitable Gift FundGeneral Board of Global Ministries of the United Methodist ChurchMott PhilanthropyOpen Society FoundationsPetschek FoundationPublic Welfare Foundation Rail Down Charitable TrustDavid Rockefeller FundElizabeth B. and Arthur E. Roswell FoundationSan Francisco FoundationTikva Grassroots Empowerment Fund of Tides FoundationElsie P. van Buren FoundationWallace Global Fund Copyright 2016 by The Sentencing Project. Reproduction of this document in full or in part, and in print or electronic format, only by permission of The Sentencing more information, contact:The Sentencing Project1705 DeSales Street NW8th FloorWashington, 20036(202) Color of Justice.
2 RACIAL and ETHNIC DISPARITY in STATE PRISONS 1 TABLE OF CONTENTSO verview 3 Overall Findings 4 The Scale of DISPARITY 8 Drivers of DISPARITY 9 Recommendations for Reform 12 Conclusion 14 Appendix 16 2 The Sentencing ProjectThe Color of Justice: RACIAL and ETHNIC DISPARITY in STATE PRISONS 3 Growing awareness of America s failed experiment with mass incarceration has prompted changes at the STATE and federal level that aim to reduce the scale of imprisonment.
3 Lawmakers and practitioners are proposing smart on crime approaches to public safety that favor alternatives to incarceration and reduce odds of recidivism. As a result of strategic reforms across the criminal justice spectrum, combined with steadily declining crime rates since the mid-1990s, prison populations have begun to stabilize and even decline slightly after decades of unprecedented growth. In states such as New Jersey, New York, Rhode Island, and California, prison depopulation has been substantial, declining by 20-30%.1 Still, America maintains its distinction as the world leader2 in its use of incarceration, including more than million people held in STATE PRISONS around the At the same time of productive bipartisan discussions about improving criminal justice policies and reducing prison populations, the continues to grapple with troubling RACIAL tensions. The focus of most recent concern lies in regular reports of police brutality against people of color, some of which have resulted in deaths of black men by law enforcement officers after little or no apparent provocation.
4 Truly meaningful reforms to the criminal justice system cannot be accomplished without acknowledgement of RACIAL and ETHNIC disparities in the prison system, and focused attention on reduction of disparities. Since the majority of people in prison are sentenced at the STATE level rather than the federal level, it is critical to understand the variation in RACIAL and ETHNIC composition across states , and the policies and the day-to-day practices that contribute to this Incarceration creates a host of collateral consequences that include restricted employment prospects, housing instability, family disruption, stigma, and disenfranchisement. These consequences set individuals back by imposing new punishments after prison . Collateral consequences are felt disproportionately by people of color, and because of concentrations of poverty and imprisonment in certain jurisdictions, it is now the case that entire communities experience these negative Evidence suggests that some OVERVIEW individuals are incarcerated not solely because of their crime, but because of racially disparate policies, beliefs, and practices, rendering these collateral consequences all the more troubling.
5 An unwarranted level of incarceration that worsens RACIAL disparities is problematic not only for the impacted group, but for society as whole, weakening the justice system s potential and undermining perceptions of justice. This report documents the rates of incarceration for whites, African Americans, and Hispanics, providing RACIAL and ETHNIC composition as well as rates of DISPARITY for each This systematic look reveals the following: KEY FINDINGS African Americans are incarcerated in STATE PRISONS at a rate that is times the imprisonment of whites. In five states (Iowa, Minnesota, New Jersey, Vermont, and Wisconsin), the DISPARITY is more than 10 to 1. In twelve states , more than half of the prison population is black: Alabama, Delaware, Georgia, Illinois, Louisiana, Maryland, Michigan, Mississippi, New Jersey, North Carolina, South Carolina, and Virginia. Maryland, whose prison population is 72% African American, tops the nation.
6 In eleven states , at least 1 in 20 adult black males is in prison . In Oklahoma, the STATE with the highest overall black incarceration rate, 1 in 15 black males ages 18 and older is in prison . states exhibit substantial variation in the range of RACIAL DISPARITY , from a black/white ratio of :1 in New Jersey to :1 in Hawaii. Latinos are imprisoned at a rate that is times the rate of whites. Hispanic/white ETHNIC disparities are particularly high in states such as Massachusetts ( :1), Connecticut ( :1), Pennsylvania ( :1), and New York ( :1). 4 The Sentencing ProjectThe Bureau of Justice Statistics reports that 35% of STATE prisoners are white, 38% are black, and 21% are In twelve states more than half of the prison population is African American. Though the reliability of data on ethnicity is not as strong as it is for race estimates, the Hispanic population in STATE PRISONS is as high as 61% in New Mexico and 42% in both Arizona and California.
7 In an additional seven states , at least one in five inmates is While viewing percentages reveals a degree of disproportion for people of color when compared to the overall general population (where 62% are white, 13% are black, and 17% are Hispanic),9 viewing the composition of prison populations from this perspective only tells some of the story. In this report we present the rates of RACIAL and ETHNIC DISPARITY , which allow a portrayal of the overrepresentation of people of color in the prison system accounting for population in the general This shows odds of imprisonment for individuals in various RACIAL and ETHNIC is important to note at the outset that, given the absence or unreliability of ethnicity data in some states , the RACIAL / ETHNIC disparities in those states may be understated. Since most Hispanics in those instances would be counted in the white prison population, the white rate of incarceration would therefore appear higher than is the case, and consequently the black/white and Hispanic/white ratios of DISPARITY would be lower as well.
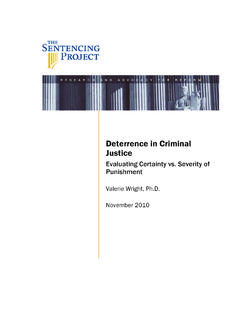
8 In four states , data on ethnicity is not reported to the Bureau of Justice Statistics, nor is it provided in the STATE department of corrections individual annual reports. These states are Alabama, Maryland, Montana, and Vermont. There are most assuredly people in prison in these states who are Hispanic, but since the STATE does not record this information, the exact number is unknown. Figure 1 provides a national view of the concentration of prisoners by race and ethnicity as a proportion of their representation in the STATE s overall general population, or the rate per 100,000 residents. Looking at the average STATE rates of incarceration, we see that overall blacks are incarcerated at a rate of 1,408 per 100,000 while whites are incarcerated at a rate of 275 per 100,000. This means that blacks are incarcerated at a rate that is times that of whites. This national look also shows that Hispanics are held in STATE PRISONS at an average rate of 378 per 100,000, producing a DISPARITY ratio of :1 compared to whites.
9 OVERALL FINDINGSData source: United states Department of Justice. Office of Justice Programs. Bureau of Justice Statistics. National Prisoner Statistics, 1978-2014. Bibliographic Citation: ICPSR36281-v1. Ann Arbor, MI: Inter-university Consortium for Political and Social Research [distributor], 2015-10-09; Census Bureau (2013). 2013 Population Estimates. Annual estimates of resident population by sex, race, and Hispanic origin for the United states , states and counties: April 1, 2010 to July 1, 2013. Washington, DC: Census 1. Average rate of incarceration by race and ethnicity, per 100,000 populationWhiteHispanicBlack1,408378275 The following tables present STATE rates of incarceration according to their rank. Table 1 shows how RACIAL disparities play out at the STATE level. The states with the highest rate of African American (male and female) incarceration are Oklahoma, Wisconsin, Vermont, Iowa, and Idaho. The Color of Justice: RACIAL and ETHNIC DISPARITY in STATE PRISONS 5 Table 1.
10 Incarceration rates per 100,000 by race, by black (male and female) incarceration rateStateWhiteBlackHispanicOklahoma58026 25530 Wisconsin2212542563 Vermont*2252357 Not ProvidedIowa2112349361 Idaho4582160619 Arizona4442126842 Oregon3662061395 Montana3161985 Not ProvidedColorado2601891587 Texas4571844541 Pennsylvania2041810668 California2011767385 Louisiana438174034 Kansas2461734301 Michigan253168293 Nebraska2011680359 Arkansas4431665251 Missouri4041654232 Ohio2891625334 Florida448162185 Indiana3391616302 Nevada3871592337 Illinois1741533282 South Dakota3091493480 Utah2021481333 Alabama4251417 Not ProvidedKentucky4311411183 STATE Average2751408378 Connecticut*1481392583 Virginia2801386116 New Mexico2081326422 Wyoming3751307495 Washington2241272272 Delaware*2591238220 West Virginia3481234167 Minnesota1111219287 Tennessee3161166180 New Jersey941140206 Georgia3291066235 Alaska*2781053148 Mississippi*3461052207 New Hampshire2021040398 South Carolina2381030172 North Carolina221951221 Rhode Island*112934280 New York112896351