Transcription of Rainfall and Runoff Periods - iowasudas.org
1 2B-2. Design Manual Chapter 2 - Stormwater 2B - Urban Hydrology and Runoff Rainfall and Runoff Periods A. Introduction 1. The first step in any hydrologic analysis is an estimation of the Rainfall that will fall on the site for a given time period. The amount of Rainfall can be quantified with the following characteristics: a. Duration (hours): Length of time over which Rainfall (storm event) occurs. b. Depth (inches): Total amount of Rainfall occurring during the storm duration. c. Intensity (inches per hour): Depth divided by the duration. 2. A design event is used as a basis for determining the requirements of new stormwater improvements or evaluating an existing project.
2 It is presumed that the project will function properly if it can accommodate the design event at full capacity. For economic reasons, some risk of failure is allowed in selection of the design event. This risk is usually related to return period. 3. The frequency of a Rainfall event is the average recurrence interval of storms having the same duration and volume (depth). This can be expressed either in terms of exceedence probability or return period. a. Exceedence Probability: Probability that a storm event having the specified duration and volume will be exceeded in one given time period, typically 1 year.
3 B. Return Period: Average length of time between events that have the same duration and volume. Thus, if a storm event with a specified duration and volume has a 1% chance of occurring in any given year, then it has an probability of exceeding , and a return period of 100 years. Table : Chance of a Storm Equaling or Exceeding a Given frequency During a Given Time Period Return Period Time Period in Years (years) 1 5 10 25 50 100. 2 50% 97% 5 20% 67% 89% 10 10% 41% 65% 93% 99% 25 4% 18% 34% 64% 87% 98%. 50 2% 10% 18% 40% 64% 87%. 100 1% 5% 10% 22% 40% 63%. 1 Revised: 2013 Edition Chapter 2 - Stormwater Section 2B-2 - Rainfall and Runoff Periods B.
4 Rainfall frequency Analysis In April 2013, the National Oceanic and Atmospheric Administration (NOAA) released Atlas 14: Precipitation- frequency Atlas of the United States, Volume 8. Volume 8 of this publication covers the Midwestern States, including Iowa, and supersedes Bulletin 71: Rainfall frequency Atlas of the Midwest (1992) as the most current precipitation data available. The Atlas 14 results are provided through NOAA's Precipitation frequency Data Server ( ). Based upon user input, the online database generates a precipitation- frequency estimate (PFE) for an individual location from the historical records of approximately 280 precipitation recording stations across the State of Iowa.
5 The location-specific PFE attribute of Atlas 14 means that precipitation- frequency estimates could be generated for each community or even each individual project, resulting in hundreds or even thousands of PFE's across Iowa. This situation would be both inefficient for designers and impractical for reviewers. To avoid this dilemma, regional intensity-duration- frequency (IDF) tables corresponding to the nine Iowa climatic sections in Bulletin 71 were developed. Utilizing Atlas 14, PFE's were obtained at each county seat. The county values within each climatic section were then averaged to represent the section as a whole.
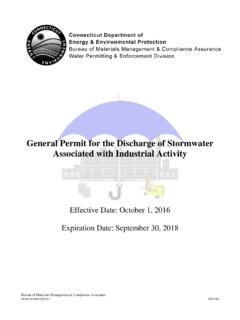
6 The resulting IDF values for each climatic section are provided in Tables through below. Figure : Climatic Sectional Codes for Iowa 1 - Northwest 4 - West Central 7 - Southwest 2 - North Central 5 - Central 8 - South Central 3 - Northeast 6 - East Central 9 - Southeast 2 Revised: 2015 Edition Chapter 2 - Stormwater Section 2B-2 - Rainfall and Runoff Periods Table : Section 1 - Northwest Iowa Rainfall Depth and Intensity for Various Return Periods Return Period 1 year 2 year 5 year 10 year 25 year 50 year 100 year 500 year Duration D I D I D I D I D I D I D I D I. 5 min 10 min 8 15 min 30 min 1 hr 2 hr 3 hr 6 hr 12 hr 24 hr 48 hr 3 day 4 day 7 day 10 day D = Total depth of Rainfall for given storm duration (inches).
7 I = Rainfall intensity for given storm duration (inches/hour). Table : Section 2 - North Central Iowa Rainfall Depth and Intensity for Various Return Periods Return Period 1 year 2 year 5 year 10 year 25 year 50 year 100 year 500 year Duration D I D I D I D I D I D I D I D I. 5 min 10 min 15 min 30 min 1 hr 2 hr 3 hr 6 hr 12 hr 24 hr 48 hr 3 day 4 day 7 day 10 day D = Total depth of Rainfall for given storm duration (inches). I = Rainfall intensity for given storm duration (inches/hour). 3 Revised: 2015 Edition Chapter 2 - Stormwater Section 2B-2 - Rainfall and Runoff Periods Table : Section 3 - Northeast Iowa Rainfall Depth and Intensity for Various Return Periods Return Period 1 year 2 year 5 year 10 year 25 year 50 year 100 year 500 year Duration D I D I D I D I D I D I D I D I.
8 5 min 10 min 15 min 30 min 1 hr 2 hr 3 hr 6 hr 12 hr 24 hr 48 hr 3 day 4 day 7 day 10 day D = Total depth of Rainfall for given storm duration (inches). I = Rainfall intensity for given storm duration (inches/hour). Table : Section 4 - West Central Iowa Rainfall Depth and Intensity for Various Return Periods Return Period 1 year 2 year 5 year 10 year 25 year 50 year 100 year 500 year Duration D I D I D I D I D I D I D I D I. 5 min 10 min 15 min 30 min 1 hr 2 hr 3 hr 6 hr 12 hr 24 hr 48 hr 3 day 4 day 7 day 10 day D = Total depth of Rainfall for given storm duration (inches). I = Rainfall intensity for given storm duration (inches/hour).
9 4 Revised: 2015 Edition Chapter 2 - Stormwater Section 2B-2 - Rainfall and Runoff Periods Table : Section 5 - Central Iowa Rainfall Depth and Intensity for Various Return Periods Return Period 1 year 2 year 5 year 10 year 25 year 50 year 100 year 500 year Duration D I D I D I D I D I D I D I D I. 5 min 10 min 15 min 30 min 1 hr 2 hr 3 hr 6 hr 12 hr 24 hr 48 hr 3 day 4 day 7 day 10 day D = Total depth of Rainfall for given storm duration (inches). I = Rainfall intensity for given storm duration (inches/hour). Table : Section 6 - East Central Iowa Rainfall Depth and Intensity for Various Return Periods Return Period 1 year 2 year 5 year 10 year 25 year 50 year 100 year 500 year Duration D I D I D I D I D I D I D I D I.
10 5 min 10 min 15 min 30 min 1 hr 2 hr 3 hr 6 hr 12 hr 24 hr 48 hr 3 day 4 day 7 day 10 day D = Total depth of Rainfall for given storm duration (inches). I = Rainfall intensity for given storm duration (inches/hour). 5 Revised: 2015 Edition Chapter 2 - Stormwater Section 2B-2 - Rainfall and Runoff Periods Table : Section 7 - Southwest Iowa Rainfall Depth and Intensity for Various Return Periods Return Period 1 year 2 year 5 year 10 year 25 year 50 year 100 year 500 year Duration D I D I D I D I D I D I D I D I. 5 min 10 min 15 min 30 min 1 hr 2 hr 3 hr 6 hr 12 hr 24 hr 48 hr 3 day 4 day 7 day 10 day D = Total depth of Rainfall for given storm duration (inches).