Example: confidence

Ratio Analysis Spreadsheet “TheScorecard”

Ratio Analysis Spreadsheet TheScorecard Year 1 Year 2 Year 3 Industry CompositeCalculations, Trends, or SHEET RATIOS: Stability (Staying Power) AssetsCurrent + Accts. -Wor t hTotal LiabilitiesNet WorthINCOME STATEMENT RATIOS: Profitability (Earning Power) MarginGross MarginNet Profit Before TaxSalesASSET MANAGEMENT RATIOS: Overall Efficiency to AssetsSalesTotal on AssetsNet Profit Before TaxTotal onInvestmentNet Profit Before TaxNet WorthASSET MANAGEMENT RATIOS: Working Capital Cycle TurnoverCost of Goods Turn-Days360 Inventory Receivable TurnoverSalesAccounts Receivable Turn-Days360 Accts. Rec. PayableTurnoverCost of Goods SoldAccounts Payable14 .Average PaymentPeriod360 Accts.

Ratio Analysis Spreadsheet “TheScorecard” Year 1 Year 2 Year 3 Industry Composite Calculations, Trends, or Observations. BALANCE …

Tags:

  Analysis

Information

Domain:

Source:

Link to this page:

Please notify us if you found a problem with this document:

Other abuse

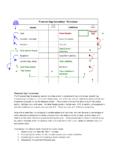
Transcription of Ratio Analysis Spreadsheet “TheScorecard”

1 Ratio Analysis Spreadsheet TheScorecard Year 1 Year 2 Year 3 Industry CompositeCalculations, Trends, or SHEET RATIOS: Stability (Staying Power) AssetsCurrent + Accts. -Wor t hTotal LiabilitiesNet WorthINCOME STATEMENT RATIOS: Profitability (Earning Power) MarginGross MarginNet Profit Before TaxSalesASSET MANAGEMENT RATIOS: Overall Efficiency to AssetsSalesTotal on AssetsNet Profit Before TaxTotal onInvestmentNet Profit Before TaxNet WorthASSET MANAGEMENT RATIOS: Working Capital Cycle TurnoverCost of Goods Turn-Days360 Inventory Receivable TurnoverSalesAccounts Receivable Turn-Days360 Accts. Rec. PayableTurnoverCost of Goods SoldAccounts Payable14 .Average PaymentPeriod360 Accts.

2 Payable Turnovercopyright 2018 Business Resource Services


Related search queries