Transcription of RBC At a Glance
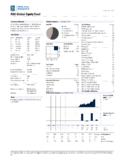
1 $ billionsQ1/2018Q4/2017Q1/2018 Moody'sS&PDBRSF itchAssets1, , Equity Tier 1 (Net of Allowanc e) Liquidity Coverage Ratio122%NegativeNegativeStab leStab Leverage at a Glance Q1/2018 All information is presented in Canadian dollars and is based on International Financial Reporting Standards (IFRS), and as at January 31, 2018 unless otherwise indicated. Canada s largest bank by market capitalization(1)with broad leadership in financial services One of North America s leading diversified financial services companies Top 15 bank globally based on market capitalization(1), with operations in 36 countries 81,000+ employees with more than 16 million clients worldwideKey Ratios(2)Credit Ratings(3)
2 Financial HighlightsShareholder PerformanceStrategic GoalsCompany OverviewCanadaTo be the undisputed leader in financial be the preferred partner to corporate, institutional and high net worth clients and their businessesGlobalTo be a leading financial services partner valued for our expertise(5) As at January 31, 2018.(6) Based on the global peer group approved by our Board of Directors. For the list of peers, please refer to our 2017 Annual Report. Annualized TSR is calculated based on the TSX common share price appreciation plus reinvested dividend (2) CET1 ratio and Leverage ratio calculated on an All-In Basel III basis.
3 CET1 ratio calculated to include all regulatory adjustments required by 2019 retaining the phase-out rules of non-qualifying capital. (3) Based on senior long-term debt ratings as at January 31, 2018. (4) ROE does not have a standardized meaning under GAAP and may not be comparable to similar measures disclosed by other financial institutions. For further information, refer to the Key performance and non-GAAP measures section of our Q1 2018 Report to Shareholders. Revenue ($ billions)Net Income ($ billions)Diluted Earnings per Share ($)Return on Equity (ROE)(4) on dividends declared per common share(1) As at January 31, Balance Sheet ItemsMarket Capitalization (US$ billions)(5)124 Annualized TSR (3 and 5-years)(5)(6)RBC18% / 16%Peer Average15% / 14%Current Quarterly Dividend ($)(5) Yield(5)
4 SymbolRYStock ExchangesTSX / NYSE RBC declared a quarterly dividend of increase of $ or 3% to $ per share Q1/2018 payout ratio of 45% was in line with our target of 40-50%$ $ $ $ $ $ $ $ $ $ $ 2007200820092010201120122013201420152016 2017 Personal & Commercial Banking48%Capital Markets22%Wealth Management17%Insurance6%Investor & Treasury Services7%Personal & Commercial BankingThe financial services leader in Canada with a presence in the Caribbean and the RBC is the market leading retail bank in Canada; Platinum Award in Customer Experience and Engagement , Bronze Award for Loyalty and Advocacy and Customer Service Innovation Award for the RBC Rewards program (1), Highest in Customer Satisfaction Among the Big Five Retail Banks for the second consecutive year and Highest in Customer Satisfaction Among Canadian Mobile Banking Apps (2), and ranked Best Global Retail Bank of the Year and Best Branch Strategy (3)
5 2ndlargest bank by assets in English Caribbean, serving ~1 million clients in 16 countries and territories cross-border banking for Canadian clients through online channels Broad suite of products and financial services to individual and business clientsWealth ManagementA leading global wealth and asset manager Top 5 global wealth manager by assets(4) #1 in Canada Largest fund company(5)and leader in high net worth market share(6) Enhancing global solutions and capabilities; City National accelerates growth in the Investment, trust, banking, credit and other wealth management and asset management solutionsInsuranceA market leader with a broad suite of products and strong distribution Canadian market leader and among the fastest growing insurance organizations in the country(7)
6 Wide range of life, health, home, auto, travel and wealth accumulation solutions to individual and group clients across Canada, and offer reinsurance solutions for clients globallyInvestor & Treasury ServicesA leading global asset servicer with an integrated client offering Specialist provider of asset services, custody, payments and treasury services for financial and other institutional investors worldwide Canadian leader in cash management, correspondent banking and trade finance for financial institutions(8) Short-term funding and liquidity management for RBCC apital MarketsA premier North American investment bank with select global reach in Europe and Asia-Pacific 10thlargest global investment bank by fees(9) Best Investment Bank in Canada across Equity, Debt and M&A for 10thconsecutive year(10) Corporate lending, merger & acquisition advisory, equity & debt origination, sales & trading, and research(1)Loyalty 360, 2017.
7 (2) Power, 2017.(3)Retail Banker International, 2017.(4)Scorpio Partnership Global Private Banking Benchmark, 2017.(5)Investment Funds Institute of Canada (IFIC), December 2017.(4)Investor Economics, December 2017.(5)LIMRA, MSA and company market share data.(6)SWIFT Watch, August 2017 & Global Finance, 2017.(9)Dealogic Trailing 12 Months (February 2017 to January 2018). (10)Euromoney, 2017. Almost two-thirds of revenue from Canada Strategic approach in key businesses in the and select international marketsRevenue by Geography(11)Earnings by Business Segments(11) Diversified business mix, with leading client franchisesRBC Investor Transfer Agent -Computershare Trust Company of InquiriesWeb at a Glance Q1/2018 Business Segments OverviewFinancial Performance by Business Segment and Geography (Latest 12 months ended January 31, 2018)(11) Excludes Corporate Support.
8 These are non-GAAP Financial Performance by Business Segments(12)($ millions, unless otherwise noted)(12) As reported. (13) ROE does not have a standardized meaning under GAAP and may not be comparable to similar measures disclosed by other financial institutions. For further information, refer to the Key performance and non-GAAP measures section of our Q1 2018 Report to Shareholders. (14) Represents period-end spot $4,165 Revenue$2,783 Revenue$1,144 Revenue$676 Revenue$2,175 Net Income$1,521 Net Income$597 Net Income$127 Net Income $219 Net Income$748 ROE(13) (13) (13) (13) (13) ($ billions)(14)$651 Premiums &AUA ($ billions)(14)$4,432 AUA ($ billions)(14)$939 Deposits 1,095 Capital MarketsPersonal & Com m ercial BankingWealth Managem entInvestor & Treasury ServicesInsuranc
