Transcription of RBC Emerging Markets Equity Fund - Mutual Funds
1 Printed on October 23, 2018 2018. Morningstar Research Inc. All Rights Reserved. The information contained herein: (1) is proprietary to Morningstar and/or its content providers; (2) may not be copied or distributed; and (3) is not warranted to be accurate, complete ortimely. Neither Morningstar nor its content providers are responsible for any damages or losses arising from any use of this information. Past performance is no guarantee of future results. These pages are not complete without the Emerging Markets Equity FundInvestment ObjectiveTo provide long-term capital fund investsprimarily in Equity securities of companies located oractive in Emerging DetailsSeriesLoad StructureCurrencyFund CodeDNo LoadCADRBF1099 DNo LoadUSDRBF1416 Inception DateDecember 2009 Total fund Assets $Mil4, D NAV $ D MER % Emerging MarketsTotal Return Net Index ($C)Income DistributionAnnuallyCapital Gains DistributionAnnuallySales StatusOpenMin.
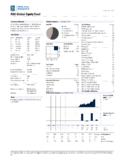
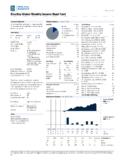
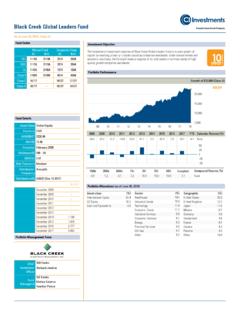
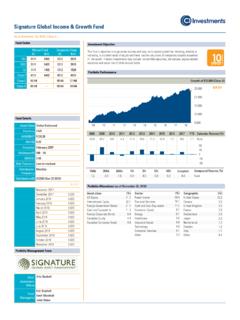
2 Investment $500 Subsequent Investment $25 fund CategoryEmerging Markets EquityManagement CompanyRBC Global AssetManagement Analysis is in CAD and for CAD series Dfund (RBF1099).Portfolio Analysisas of September 30, 2018 Asset Mix% StyleValueBlendGrowthLargeMidSmallEquity StatisticsP/B Mkt Cap. $ 5 Sectors% Allocations% 25 Holdings% AssetsNaspers Ltd Class Semiconductor Development Finance Corp Group Consultancy Services Investments An Insurance (Group) Co of China Financial Group Co Mobile Enterprises Group do Brasil SA BB Reddy's Laboratories Ltd Inc Glass Industry Group Co Economico Mexicano SAB de Kalbe Farma Fire & Marine Insurance Co Bank Central Asia Electronics (Thailand) % of Top 25 Number of Stock Holdings54 Total Number of Bond Holdings0 Total Number of Other Holdings1 Total Number of Holdings55 Performance Analysis as of September 30, 20188101214161820 Growth of $10,000 Series D$17,894-1501530452008 2009 Returns %Series DFundQuartile1 Mth3 Mth6 Mth1 Yr3 Yr5 Yr10 YrSince Return % Quartile25124723022814711855 No.
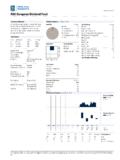
3 Of Funds in CategoryPrinted on October 23, 2018 2018. Morningstar Research Inc. All Rights Reserved. The information contained herein: (1) is proprietary to Morningstar and/or its content providers; (2) may not be copied or distributed; and (3) is not warranted to be accurate, complete ortimely. Neither Morningstar nor its content providers are responsible for any damages or losses arising from any use of this information. Past performance is no guarantee of future results. These pages are not complete without the Emerging Markets Equity FundManagement OverviewManager BiosPhilippe LanghamRBC Global Asset Management (UK) LimitedPhilippe is Head of Emerging Markets Equities & SeniorPortfolio Manager. He has worked in the investmentindustry since 1992 and joined the firm in 2009 toestablish and lead the team that manages the emergingmarkets Equity strategies. Prior to RBC, Philippe wasHead of Global Emerging Markets with Soci t G n raleAsset Management Philippe holds a Bachelor sdegree in Economics from the University of Manchesterand is a qualified Chartered Analysis Cont'd as of September 30, 2018 Distributions ($)/UnitYTD*2017201620152014201320122011 201020092008 Total Distributions Interest Dividends Capital Gains Return Of Capital EndedEndedEndedEnded1-20155-20155-2017 12-20119-20134-2016 Best/Worst Periods %1 Yr3 Yr5 Yr10 No.
4 Of Periods947046 Pct. * Distributions are characterized into income type at Commentary as at September 30, 2018 Emerging market equities fell by in Q3. Thisfairly muted overall number masks substantialvolatility over the period. In particular, we havefound wide dispersion in country performance,which has been the key driver of overall EM the top country performers over thequarter have been Thailand (+ ), Mexico(+ ) and Taiwan (+ ), while Turkey( ), China ( ) and South Africa ( )have been amongst the worst. Turkey s poorperformance has been driven by concerns overPresident Erdogan s influence on monetary policyand China has been weak on the back of theescalating trade tensions with the Thailandhas benefited from strong export data andMexico s new president, Andr s Manuel L pezObrador, has adopted a more moderate stancethan was first anticipated by selection was the main driver of relativereturns, while top-down country and sectorpositioning detracted.
5 At the sector level, stockselection was especially strong in InformationTechnology while our lack of exposure to Energywas the main detractor from a owning Chinese internet giant Tencent wasthe biggest contributor to relative returns in Q3after the Chinese government announcedproposals to curb video-game releases and limitthe amount of time children spend playing onlinegames. This negatively impacted the stock asTencent derives a significant portion of itsrevenues from gaming. Indian IT services companyTata Consultancy Services remains a top performerin the portfolio and continues to report significantdeal was the biggest detractor in Q3. Thecompany s share price was affected by the sell-offin Tencent as it owns a 31% stake in the also detracted amid concerns relating torising funding costs and liquidity issues amongstIndian non-bank financials which drove broaderweakness across the Financials sector in on October 23, 2018 2018.
6 Morningstar Research Inc. All Rights Reserved. The information contained herein: (1) is proprietary to Morningstar and/or its content providers; (2) may not be copied or distributed; and (3) is not warranted to be accurate, complete ortimely. Neither Morningstar nor its content providers are responsible for any damages or losses arising from any use of this information. Past performance is no guarantee of future results. These pages are not complete without the Emerging Markets Equity FundDisclosureRBC Funds , BlueBay Funds , PH&N Funds andRBC Corporate Class Funds are offered byRBC Global Asset Management Inc. anddistributed through authorized , trailing commissions,management fees and expenses all may beassociated with Mutual fund read the prospectus or fund Factsdocument before investing. Except asotherwise noted, the indicated rates of returnare the historical annual compounded totalreturns including changes in unit value andreinvestment of all distributions and do nottake into account sales, redemption,distribution or optional charges or incometaxes payable by any unitholder that wouldhave reduced returns.
7 Mutual Funds are notguaranteed or covered by the CanadianDeposit Insurance Corporation or by any othergovernment deposit insurer. For moneymarket Funds , there can be no assurancesthat the fund will be able to maintain its netasset value per unit at a constant amount orthat the full amount of your investment in thefund will be returned to you. The value ofmutual Funds change frequently and pastperformance may not be document has been compiled by RBCG lobal Asset Management Inc. (RBC GAM)from sources believed to be reliable, but norepresentations or warranty, express orimplied, are made by RBC GAM, its affiliatesor any other person as to its accuracy,completeness or correctness. All opinionsand estimates constitute RBC GAM'sjudgment as of the date of this document, aresubject to change without notice and areprovided in good faith but without legalresponsibility. The Top Ten/25 Holdings maychange due to ongoing portfolio transactionswithin the fund .
8 The Prospectus and otherinformation about the underlying investmentfunds are available at (%) for RBC Funds , PH&N Funds andBlueBay Funds is based on actual expensesfor the half-year period, January 1 to June30, 2018, expressed on an annualized (%) for RBC Corporate Class Funds isbased on actual expenses for the full yearperiod, April 1, 2017 to March 31, H and Series I are not available forpurchase by new investors. Existinginvestors who hold Series H or Series I unitscan continue to make additional investmentsinto the same series of the Funds they are only used to illustrate the effectsof the compound growth rate and do notreflect future values of any fund or returns oninvestment of any fund profile is provided for informationalpurposes only. Particular investments and/ortrading strategies should be evaluatedrelative to each individual s investmentobjectives. The information contained in thefund profile is not, and should not beconstrued as, investment or tax advice.
9 Youshould not act or rely on the informationcontained in the fund profile without seekingthe advice of an appropriate rankings are determined byMorningstar Research Inc., an independentresearch firm, based on categoriesmaintained by the Canadian InvestmentFunds Standards Committee (CIFSC). Quartilerankings are comparisons of the performanceof a fund to other Funds in a particularcategory and are subject to change quartiles divide the data into four equalsegments expressed in terms of rank (1, 2, 3or 4). This is the Morningstar quartile rankingof Series A and F units of the fund as ofSeptember 30, 2018. / Trademark(s) of Royal Bank of under licence. RBC Global AssetManagement Inc. 2018