Transcription of Remittance Prices Worldwide - Issue 38, June 2021
1 Remittance Prices Worldwide - Issue 38, June 2021 03 Remittance Prices Worldwide - Issue 38, June 2021 2 This Report reflects the latest trends observed in the data published in June 2021. Remittance Prices Worldwide is available at The World Bank Group, 2021 Remittance Prices Worldwide - Issue 38, June 2021 3 Key findings The Global Average recorded a decrease from percent in Q1 2021 to percent in Q2 2021. The International MTO Index experienced a moderate increase over the quarter to in Q2 2021, from percent in Q1 2021. This is the fifth consecutive quarter in which this figure has been recorded below percent. The Global Weighted Average increased to percent in Q2 2021, from percent in Q1 2021. This is the third quarter in which this figure has been recorded below percent. The Global SmaRT Average for Q2 2021 was recorded at percent. The Digital remittances index decreased from percent in Q1 2021 to percent in Q2 2021.
2 South Asia remains the lowest cost receiving region, with an average cost of percent. Sub-Saharan Africa remains the most expensive region to send money to, recorded at percent total average cost in Q2 2021. Banks remain the most expensive type of service provider, with an average cost of percent. The proportion of corridors with average costs of less than 5 percent has increased considerably since Q1 2009 (from 17 percent to 41 percent in Q2 2021). In Q2 2021, mobile money was the least costly instrument to originate remittances and was also the least cost instrument to receive remittances. Overview Remittance Prices Worldwide (RPW) monitors Remittance Prices across all geographic regions of the world. Launched in September 2008, RPW monitors the cost incurred by remitters when sending money along major Remittance corridors. RPW is used as a reference for measuring progress towards global cost reduction objectives, including the G20 commitment to reduce the global average to 5 percent, which is being pursued in partnership with governments, service providers, and other stakeholders.
3 Since Q2 2016, RPW covers 48 Remittance sending countries and 105 receiving countries, for a total of 367 country corridors Worldwide . RPW tracks the cost of sending remittances for four main RSP types: Banks, MTOs, Mobile Operators, and Post Offices. MTOs include both traditional providers and innovative/fintech players. On average, services per corridor are tracked. This Report uses data from RPW s most recent release to analyze the global, regional, and country specific trends in the average cost of migrant remittances. FXC Intelligence provides the underlying data used in the RPW. The World Bank is calling for feedback to improve the RPW dataset in regard to provider and product coverage within the scope of the RPW methodology. We would like to hear your feedback at: Remittance Prices Worldwide - Issue 38, June 2021 4 Table of Contents 3 Key findings .. 3 Progress tracker .. 5 Global trends .. 6 Global average experiences reduction.
4 6 International MTO Index .. 7 Global weighted average .. 8 Smart Remitter Target (SmaRT) .. 9 Trends in corridor average total costs .. 10 G8 and G20 countries .. 11 Cost of sending remittances from G8 countries .. 11 Cost of sending remittances from and to G20 countries .. 11 Regional trends .. 14 Cost structure .. 15 Cash vs. Digital Services .. 15 Costs by RSP Type .. 15 Costs by Sending and Receiving Method .. 16 Annex I Tables ($200) .. 18 Annex II - Cost Trends for Sending $500 .. 19 Global trends for sending $ 19 Global average total cost .. 19 International MTO Index .. 20 G20 Countries .. 20 Cost of sending remittances from and to G20 countries .. 20 Annex III Tables ($500) .. 23 Remittance Prices Worldwide - Issue 38, June 2021 5 Progress tracker RPW indicators are used to measure the progress towards targets of global efforts for the reduction of Remittance costs. The G8 (L Aquila, 2010) and the G20 (Cannes, 2011 and Brisbane, 2014) committed to reduce the Global Average Total Cost to 5 percent.
5 The UN SDGs have indicated a target of 3 percent for the Global Average to be reached by 2030. At the same time, the UN SDGs have also committed to ensuring that in all corridors, remittances can be transferred for 5 percent or less. The figure below summarizes the progress towards these three targets. Changes in Q2 2021 In Q2 2021, RPW underwent a change in data classification which is summarized below. During the Q2 2021 data collection period, the team has found that pricing in a corridor has started to diverge for some service providers based on different payment instruments and/or different ways of accessing the service on both ends of the corridor. In such instances, the existing services in the database that included multiple instruments and/or access types were separately recorded in the Q2 2021 dataset to capture the different price information. As such, the total number of products have increased to 15 per corridor, compared with per corridor using the previous categorization in Q1 Overall, a non-material decrease across RPW indicators was observed because of this change.
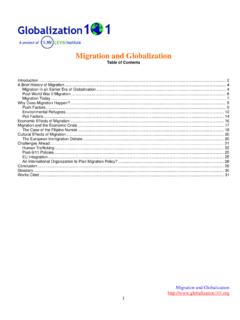
6 Compared to cash services, digital services with flexible payment instrument and multiple access points account for a larger share of the newly added services. 1 Please note that the number of available products overall have declined since the start of the COVID-19 pandemic due to mainly the unavailability of cash-based services. Prior to the start of the pandemic, in Q1 2020, the number of services included in RPW per corridor was on average. Remittance Prices Worldwide - Issue 38, June 2021 6 Global trends Global average experiences reduction In Q2 2021, the Global Average cost for sending remittances was percent. It represents a decrease from in Q1 2021. The Global Average has remained below percent since Q1 2019 (see Figure 1 below and Table 1 in the Annex). Overall, this represents a decline of percentage points since Q1 2009, when the figure was recorded at percent. In addition to the Global Average, another average total cost is introduced to track the average price of digital remittances in RPW In Q2 2021, the global average for digital remittances was recorded at percent, while the global average for non-digital remittances was percent.
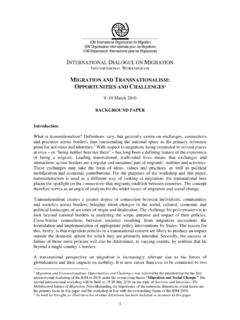
7 Digital services account for 26% of all services RPW collected in Q2 2021. Figure 1 Trends in the global cost of sending $200 in remittances3 2 A digital Remittance must be sent via a payment instrument in an online or self-assisted manner, and received into a transaction account, , bank account, transaction account maintained at a non-bank deposit taking institution (say a post office), mobile money or e-money account. 3 Figures for the global average were adjusted in Q1 2014 following a clean-up of the entire database. Some values slightly vary from figures published prior to Q1 2014. Remittance Prices Worldwide - Issue 38, June 2021 7 International MTO Index The International MTO Index tracks the Prices of MTOs that are present in at least 85 percent of corridors covered in the RPW In Q2 2021, the International MTO Index recorded a moderate increase to from the previous value of percent in Q1 2021. Over the year, this figure was down by of a percentage point, recorded at percent in Q2 2020.
8 This figure has come down by percentage points from its first recorded value of percent in Q1 2009. A second Digital-only MTO Index has been introduced to reflect the growing impact of digital and information technology innovation on the global Remittance market. Digital-only MTO refers to money transfer operators that send remittances only through digital Digital-only MTO Index has consistently remained below both the International MTO Index and the global average. In Q2 2021, Digital-only MTO Index recorded at percentage point, a modest decrease from percentage point in Q1 2021. Figure 2 Trends in International MTO Index & Digital-only MTO Index 4 The International MTOs Index includes all MTOs that are present in over 85 percent of RPW corridors. Thus far, it has included Western Union and MoneyGram, which operate in 95 percent and 90 percent of the country corridors covered in the database, respectively. 5 It includes five digital-only MTOs, Transferwise (Wise), Remitly, WorldRemit, InstaReM and Xoom.
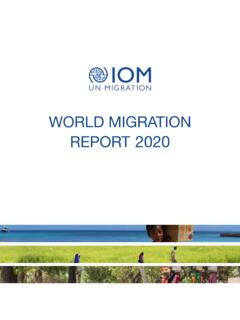
9 Remittance Prices Worldwide - Issue 38, June 2021 8 Global weighted average Also, a weighted average total cost is calculated, which accounts for the relative size of the flows in each Remittance The Global Weighted Average of sending remittances, as illustrated in Figure 3 (see also Table 1 in the Annex), has at times shown a different pattern from the simple average. In Q2 2021, the Global Weighted Average recorded at percent (in Q1 2021, this was recorded at percent). This is the third consecutive quarter in which this figure has been recorded below percent. Over the last five years, this figure has decreased by approximately percentage points recorded at percent in Q2 2016. Figure 3 Trends in Global weighted average & SmaRT average 6 It is important to note that, while official data on Remittance flows by bilateral corridors are currently not available, estimates (Ratha and Shaw 2007, last updated in 2018, available at ) have been used in this calculation.
10 These estimates are based on the Balance of Payments (BOP) and factor in migrant stocks, destination country incomes, and source country incomes. The methodology for these estimates has been questioned, as well as the accuracy of official data on Remittance flows and migrant stocks. However, this still represents the only available comprehensive dataset on bilateral Remittance flows. It also seems likely that overall, the dataset is sufficiently accurate to reflect at least the proportion between the different corridors, hence offering a good approximation to weight the relevance of each corridor in terms of flow size. Remittance Prices Worldwide - Issue 38, June 2021 9 Smart Remitter Target (SmaRT) To complement the Global Average and Global Weighted Averages described above, the World Bank introduced the SmaRT indicator in Q2 2016, which aims to reflect the cost that a savvy consumer with access to sufficiently complete information could pay to transfer remittances in each corridor.