Transcription of Renewable Energy Market Update - .NET Framework
1 Renewable EnergyMarket UpdateOutlook for 2021 and 2022 The IEA examines the full spectrum of Energy issues including oil, gas and coal supply and demand, Renewable Energy technologies, electricity markets, Energy efficiency, access to Energy , demand side management and much more. Through its work, the IEA advocates policies that will enhance the reliability, affordability and sustainability of Energy in its 30 member countries, 8 association countries and note that this publication is subject to specific restrictions that limit its use and distribution. The terms and conditions are available online at publication and any map included herein are without prejudice to the status of or sovereignty over any territory, to the delimitation of international frontiers and boundaries and to the name of any territory, city or : IEA. All rights Energy Agency Website: member countries: Australia Austria BelgiumCanadaCzech Republic DenmarkEstoniaFinland France Germany Greece HungaryIreland ItalyJapanKorea Luxembourg Mexico Netherlands New Zealand NorwayPoland Portugal Slovak Republic Spain Sweden Switzerland Turkey United Kingdom United StatesThe European Commission also participates in the work of the IEAIEA association countries:BrazilChinaIndiaIndonesiaMoroc coSingaporeSouth AfricaThailandINTERNATIONAL ENERGYAGENCYR enewable Energy Market Update Abstract Outlook for 2021 and 2022 PAGE | 2 IEA.
2 All rights reserved. Abstract Renewables were the only Energy source for which demand increased in 2020 despite the pandemic, while consumption of all other fuels declined. Will Renewable Energy source uptake therefore expand more quickly as the global economy recovers from the crisis? In exploring recent Market and policy developments, the Renewable Energy Market Update forecasts new global Renewable power capacity additions for 2021 and 2022. It also provides updated biofuel production forecasts for these years, as the sector suffered significant losses with declining transport demand during the pandemic. Renewable Energy Market Update Acknowledgements Outlook for 2021 and 2022 PAGE | 3 IEA. All rights reserved. Acknowledgements This study was prepared by the Renewable Energy Division in the Directorate of Energy Markets and Security. It was designed and directed by Heymi Bahar, Senior Analyst.
3 The lead authors of the report were Heymi Bahar (electricity) and Jeremy Moorhouse (biofuels). The report benefited from analysis and input from multiple colleagues: Yasmina Abdelilah, Piotr Bojek, Fran ois Briens, Chenlu Cheng, Trevor Criswell, Kazuhiro Kurumi and Grecia Rodr guez Jim nez (also responsible for data management). Paolo Frankl, Head of the Renewable Energy Division, provided strategic guidance and input to this work. Valuable comments and feedback were provided by Keisuke Sadamori, Director of Energy Markets and Security Directorate. Thanks go to the IEA Communication and Digital Office (CDO) for their help in producing the report and website materials, particularly to Jad Mouawad, Head of CDO, and to Jon Custer, Astrid Dumond, Merve Erdil, Christopher Gully, Jethro Mullen, Isabelle Nonain-Semelin, Julie Puech, Robert Stone, Gregory Viscusi and Therese Walsh. Kristine Douaud carried editorial responsibility.
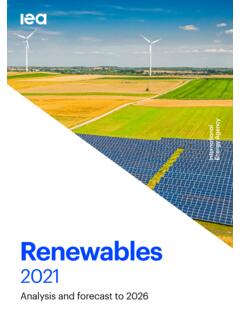
4 Renewable Energy Market Update Highlights Outlook for 2021 and 2022 PAGE | 4 IEA. All rights reserved. Highlights In 2020, annual Renewable capacity additions increased 45% to almost 280 GW the highest year-on year increase since 1999. Exceptionally high capacity additions become the new normal in 2021 and 2022, with renewables accounting for 90% of new power capacity expansion globally. Average annual net Renewable capacity additions, 2011-2022 IEA. All rights reserved. Solar PV development will continue to break records, with annual additions reaching 162 GW by 2022 almost 50% higher than the pre-pandemic level of 2019. Global wind capacity additions increased more than 90% in 2020 to reach 114 GW. While the pace of annual Market growth slows in 2021 and 2022, it is still 50% higher than the 2017-2019 average. Annual growth in the People s Republic of China s (hereafter, China ) renewables Market will decelerate following the exceptional expansion that resulted from developers rushing to complete projects before subsidy phase-outs.
5 However, the rest of the world compensates for China s slowdown and maintains the pace of renewables expansion. Europe s capacity growth accelerates thanks to further policy support and a booming corporate PPA Market as PV costs continue to decline. The updated forecast for the United States is more optimistic because of federal tax credit extensions. New US emissions reduction targets and the infrastructure bill, if passed, will boost renewables expansion after 2022 (beyond the timeframe of this forecast Update ). 0 50 100 150 200 250 3002011-132014-162017-192020-22 GWRenewable Energy Market Update Highlights Outlook for 2021 and 2022 PAGE | 5 IEA. All rights reserved. Although India s capacity additions in 2020 declined almost over 50% from 2019, the country is expected to set new records for renewables expansion in 2021 and 2022 as delayed projects from previous competitive auctions are commissioned. However, the current (April 2021) surge in Covid-19 cases has created short-term forecast uncertainty for this year.
6 Transport biofuel production is expected to rebound to 2019 volumes in 2021, after having fallen 8% in 2020. Production is also forecast to expand another 7% in 2022. Mainly driven by clean fuel standards and policy support in the US, global Hydrotreated Vegetal Oil (HVO) production capacity is expected to nearly double in the next two years, significantly expanding the capability of producing biofuels from waste and residue feedstocks. Renewable Energy Market Update Renewable electricity Outlook for 2021 and 2022 PAGE | 6 IEA. All rights reserved. Renewable electricity A quick look back at 2020 Policy deadlines in key markets propelled global Renewable capacity additions to almost 280 GW in 2020, the highest year-on-year increase in the last two decades Despite pandemic-induced supply chain challenges and construction delays, Renewable capacity additions in 2020 expanded by more than 45% from 2019, and broke another record. An exceptional 90% rise in global wind capacity additions led the expansion.
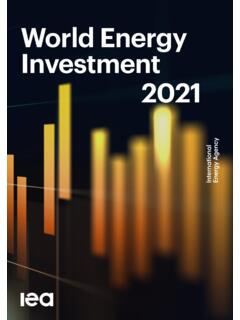
7 Also underpinning this record growth was the 23% expansion of new solar PV installations to almost 135 GW in 2020. Policy deadlines in China, the United States and Viet Nam spurred an unprecedented boom in Renewable capacity additions in 2020. China alone was responsible for over 80% of the increase in annual installations from 2019 to 2020, as onshore wind and solar PV projects contracted under China s former FIT scheme, and those awarded in previous central or provincial competitive auctions, had to be connected to the grid by the end of 2020. In the United States, wind power developers rushed to complete their projects before expiration of the production tax credit (PTC), although it was extended for another year, in December 2020. In Viet Nam, phaseout of the FIT for solar PV projects led to an unprecedented rush in commercial and residential installations. Renewable capacity addition changes from 2019 to 2020 IEA.
8 All rights reserved. 150 170 190 210 230 250 270 2902019 IndiaBrazilUkraineOthersChinaUnitedState sViet NamOthers2020 TotalDecreaseIncreaseTotalGWWindSolar PVHydropowerRenewable Energy Market Update Renewable electricity Outlook for 2021 and 2022 PAGE | 7 IEA. All rights reserved. The rush to commission projects prior to policy deadlines in these countries took place in the last quarter (Q4) of 2020, especially in December. In fact, developers connected almost 150 GW of new Renewable capacity in Q4 of 2020 more than double the number of gigawatts commissioned in Q4 of 2019 and exceeding the amount installed in the first three-quarters of 2020. Overall, IEA quarterly deployment estimates indicate that the slowdown in Renewable capacity additions was limited to Q1 2020 only, mainly in China, while construction activity continued strongly in the rest of the world despite continuous movement restrictions and supply chain delays. The December surge in new installations also indicates that solar and wind construction supply chains were able to fu rnish record numbers of projects in China, the United States, Viet Nam and various European countries.
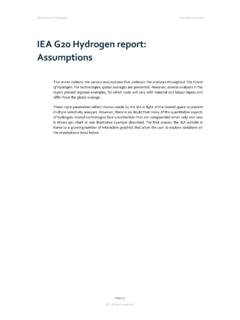
9 Quarterly Renewable capacity additions, 2019-2020 IEA. All rights reserved. Notes: Quarterly Renewable capacity additions may not add up to abovementioned annual capacity additions due to limited availability of granular data for multiple countries. APAC = asia -Pacific region. ASEAN = Association of southeast Asian Nations. 2021 and 2022 forecast summary Renewables deployment geared up in 2020, establishing a new normal for capacity additions in 2021 and 2022 The exceptional level of Renewable Energy capacity additions is expected to be maintained, with 270 GW becoming operational in 2021 and 280 GW in 2022. This expansion exceeds the record-level annual capacity additions of 2017-2019 by over 50%, such that renewables are expected to account for 90% of total global power capacity increases in both 2021 and 2022. 0 20 40 60 80 100 120 140 160Q1Q2Q3Q4Q1Q2Q3Q420192020 GWRest of worldAPACASEANI ndiaLatin AmericaEuropeUnited StatesChinaRenewable Energy Market Update Renewable electricity Outlook for 2021 and 2022 PAGE | 8 IEA.
10 All rights reserved. Net Renewable capacity additions, 2011-2022 IEA. All rights reserved. Although the amount of annual wind capacity additions is expected to decrease in 2021-2022 after the exceptional jump last year in China, 80 GW of annual installations are still anticipated globally, almost 35% more than in 2019. Continuous growth in solar PV additions, spurred by lower investment costs and ongoing policy support, partly compensates for lower wind capacity additions. We expect annual solar PV expansion to reach 145 GW in 2021 and 162 GW in 2022, breaking records and accounting for almost over 55% of all Renewable Energy expansion this year and next. The acceleration of hydropower additions through 2022 is driven by the commissioning of mega-scale projects in China. Meanwhile, expansion in other renewables, led by bioenergy, remains stable and represents 3% of total new Renewable capacity additions. Net Renewable capacity additions by technology, 2020-2022 IEA.